
PJM just served two of the highest load days in its history, back to back, under a heat dome that pushed heat indices past 110 to 115 degrees from Washington to New York. Here is how it played out, and what it means if you carry load, length, or a capacity in this market.
The setup started a week early

PJM saw this coming.
On June 25, with the heat dome still sitting in the weather models, it issued a Maintenance Outage Recall and told generators to wrap planned work and get units back online by June 30. It worked. Offline generation capacity, which across PJM's full history averages roughly 34,700 MW on a given day, ran at less than half that all week, between 15,000 and 22,000 MW. About half the fleet that would normally be parked was available and warm.
Then came the paperwork.
PJM filed applications with the Department of Energy on June 27 and June 29. On June 30 the Energy Secretary signed two emergency orders under Section 202(c) of the Federal Power Act. The first lets PJM, as a last resort before voltage reduction or load shed, direct transmission owners to move data centers and other large loads of 50 MW or more onto their own backup generation within 15 minutes of a signal. The second grants temporary relief from environmental permit limits through July 3. On July 2, PJM asked DOE to extend that relief through July 6.
The first order deserves a second look.
This is the third large-load 202(c) in PJM in 2026, after the January cold snap and the May heat-and-maintenance tightening. Pairing it with environmental permit relief is new. That did not happen in either of the earlier two. Three invocations in six months reads less like an escape hatch and more like a standing procedure. The market should price it that way. Experienced traders already watch Maintenance Outage Recalls as a leading indicator of grid stress. The 202(c) may be the next signal in that sequence.
July 1: the grid runs hot, prices run hotter
Wednesday opened with spot prices near $300/MWh in parts of the footprint before most of the workday had started. Typical off-peak LMPs in PJM sit between $25 and $40/MWh. By evening, real-time prices in congested pockets cleared past $1,000 as operators managed heavy flows and dispatched the expensive end of the stack.
PJM layered on the full alert ladder. A Hot Weather Alert across the entire footprint through at least July 3. Maximum Generation and Load Management Alerts. A Low Voltage Alert. A Heavy Load Voltage Schedule Warning asking members to switch in distribution capacitors and pull reactors to prop up transfer capability across critical interfaces.
The last one is important to pay attention to. When the RTO starts actively managing voltage to squeeze more transfer capability out of the wires, the margin conversation changed from megawatts to physics. PJM's total scheduled capacity on the day stood at 172,780 MW against a forecast peak well north of 160,000 MW.
Arcobi's Forecasts had flagged the 16:00 to 19:00 block as a high-probability peak window by mid-morning. By HE 17:45, real-time RTO load was reading 162,373 MW, with AECO RTM prices at $411.91/MWh and APS at $426.06/MWh. That lined up with the multi-zone price stress that would define the next 24 hours.
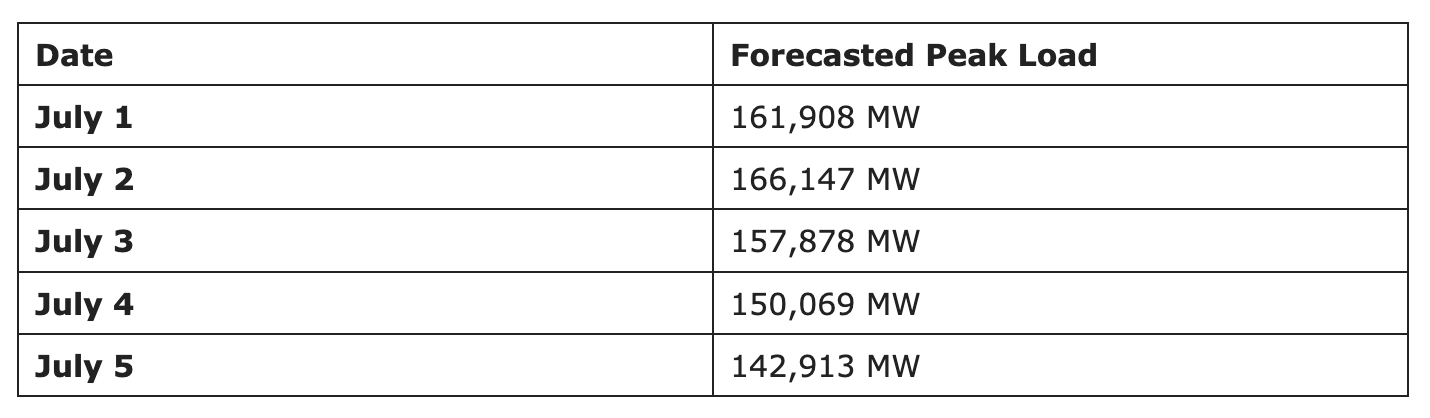
The day closed with a preliminary hourly integrated peak of 161,910 MW. One of the largest loads PJM has ever served, and it was only the warmup act.

July 2: the forecast said one thing, the grid did another
Thursday was the day everyone circled.
Day-ahead prices cleared above $2,000/MWh in PJM, with NYISO and MISO both posting four-digit prints as neighboring RTOs felt the same heat. Western Hub day-ahead LMPs peaked at $1,222.75/MWh, against $450.37/MWh during the comparable June 2025 event. Operating reserves fell to roughly 5,091 MW from about 10,996 MW the prior day, thin enough that a single large unit trip would have eaten most of the remaining cushion. As of 1 p.m., PJM's operational forecast called for a peak of 166,241 MW. That would have beaten the grid's all-time summer hourly integrated record of 165,563 MW, set in August 2006, a record that has stood for twenty years.
Then the afternoon happened.
PJM activated Pre-Emergency Demand Response across the entire RTO to build reserves ahead of the evening peak. The ISO said plainly that calling for demand response could suppress preliminary peak load totals. When the peak hour arrived, the system served a preliminary 162,626 MW. More than 5,400 MW below where PJM's own midday operational forecast had pointed.
Two things can be true at once here.
First, the RTO forecasts conservatively going into emergency conditions, and it should. A grid operator that under-forecasts a day like Thursday risks load shed. One that over-forecasts risks nothing worse than some expensive dispatch. Second, the DR deployment shaved real megawatts off the realized peak, and PJM said as much in its operations update.
But if you were positioned off the operational forecast, that gap was the whole game. Day-ahead cleared for a peak that never showed up. If you were long DA against RT, Thursday paid you. If you were running a curtailment program, the forecast you trusted decided whether you cut load at the right hour or burned a curtailment event on padding.

Reliability and Market forecasts
At HE17:30 on July 2, squarely inside the high-probability 16:00 to 18:00 window Arcobi's Forecasts had flagged in advance, real-time RTO load was reading 162,573 MW. APS RTM prices had crossed $1,001/MWh. AECO was at $953.88/MWh. Four-figure real-time prices in zones that clear between $25 and $40 on a normal day.
Our load forecast for that hour sat at 162,182 MW. Within 444 MW of the preliminary actual, about a quarter of one percent, and it had held near that level since roughly 60 to 70 hours before the event. The model also flagged 4 p.m. to 6 p.m. on July 2 as the high-probability peak window well ahead of time. The window it flagged two and a half days early was the exact hour the market was paying $1,000/MWh to get right.
PJM's operations team runs a different objective function, and a reliability forecast with a conservative bias is the right design for a grid operator. A reliability forecast and a market forecast serve different loss functions, and most participants this week had access to only one of them.
Why did it not have adverse affects?
Most price-spike events go one way. A generator trips offline, supply vanishes, and prices rip. This week nothing failed. The grid simply had more demand, and price did what price does when reserves compress to roughly 3% of served load.
The source of that demand is well documented now.
Between 2021 and 2025, the PJM Dominion zone, which covers northern Virginia and the epicenter of U.S. hyperscale data center development, grew its weather-normalized load at 6.50% per year. That is about four times the RTO-wide average of 1.63%. New transmission constraints in the Dominion zone debuted in summer 2026 and are already shifting Western Hub basis patterns. PJM's 2026 Long-Term Load Forecast puts summer peak demand growth at 3.6% per year over the next decade, reaching roughly 222 GW by 2036. Large load adjustments, almost entirely data centers, account for 78% of total demand growth through 2046.
This week was not a weather anomaly sitting on a stable grid. It was a weather anomaly sitting on a structural demand inflection that has already repriced the capacity market by roughly 900% in two years.
Coincident peaks and load-side participants
Trader coverage this week focused on constraints, spreads, and reserve levels. Fair enough. But for load-side participants, the defining event of the week is quieter.
Coming into the week, the top of the season's 5CP stack was 139,609 MW, set on June 12. Arcobi's Forecast 5th CP Threshold was sitting at 131,000 MW. Both July 1 (162,373 MW) and July 2 (162,573 MW) landed more than 22,000 MW above that prior season peak. A full rewrite of the stack in 48 hours.
PJM's capacity tag mechanism, the Peak Load Contribution (PLC), is set by a commercial and industrial customer's average demand during the five highest coincident peak hours on the RTO system in a given summer. Both days are almost certainly in the final five. Every hour a C&I load ran through the Wednesday and Thursday evening peaks is an hour that now feeds directly into next year's capacity and network transmission charges. In a year where the 2026/2027 BRA cleared at a FERC-approved cap price of $329.17/MW-day, up 22% year-over-year and the highest in PJM history, the money attached to those two hours is not trivial.
If you curtailed into the 4 to 6 p.m. windows both days, you just ran the two most valuable hours of demand management available all summer. If you did not, the meter already recorded it. The only open question is whether the rest of the season throws higher peaks that push these days out of the stack. Given where the load forecast sits for the balance of summer, that is not where informed participants should place their bets.
Remaining season risk
The season is not done with this week yet.
July 3 carries a forecast peak near 158,000 MW, with a Hot Weather Alert extended through July 4 and Maximum Generation Alerts still in effect. A holiday Friday usually gives you lighter commercial load. It does not give you lighter air conditioning load when the heat index stays north of 100 across the footprint. Friday afternoon is a live 5CP candidate.
The difference between acting and explaining starts before the peak hour. June 30 tells that story cleanly. At HE17:55, the day before the alerts, Arcobi's Forecasts were already flagging a probability peak window with load at 150,488 MW and prices starting to build. Participants who were watching had three days of runway. Those relying on the operational forecast had Thursday morning.
What this week actually tells the market
The emergency guide is being run as a seasonal procedure, not a last resort
Maintenance recall, alert ladder, voltage management, federal emergency orders, RTO-wide pre-emergency DR. PJM ran nearly every page in a five-day span, in orderly sequence, without escalating to an Energy Emergency Alert declaration. That is the system working as designed. It is also a system with no pages left if a large unit had tripped Thursday evening with 5,091 MW of operating reserves.
Demand is structural
Nothing broke this week. The load that showed up reflects a footprint where data center demand is projected to reach 35 GW by 2030 and accounts for nearly all forecast peak growth through 2036. Capacity prices have already repriced to match, hitting the FERC-approved cap for the second straight auction year. This week was a preview of the operating environment that repriced the capacity market.
Forecast quality is now a P&L line and a bill determinant at the same time
The 5,400 MW gap between PJM's operational forecast and realized load moved settlement outcomes on the trading side and CP decisions on the load side, in the same 48 hours. The operational forecast did its job. It kept the grid safe. The market forecast did a different job. It told participants where the real peak would land, which window to target, and how hard to commit curtailment resources. Knowing both numbers, and knowing which one to act on, was the difference between an optimized outcome and an explanation written after the fact.
That last one is why we build what we build. Arcobi's AI Forecasts called this week's peak windows days in advance, tracked realized load within a few hundred megawatts at the hours that mattered, and were live at the moment APS crossed $1,000/MWh.
The heat will ease this weekend, but the underlying load growth won’t.
Some Related Cases


Let's explore your energy challenge together.
Every energy challenge is different. Tell us yours, and
we'll show you what 25 years of market intelligence can do.