
25+ years of power market data, delivered at scale
DataHub delivers 25+ years of trusted, reliable power market data – price, grid metrics, licensed data, weather drivers and much more, delivered straight to your environment with zero pipeline build.
%202.avif)
Power Market Data Shouldn’t Be a Bottleneck
Teams spend more time fixing data pipelines than analyzing data. Manual ETL, deduplication, reprocessing. Fragile integrations that break when ISOs update or change formats.
Modern power markets generate huge, granular datasets across prices, demand, grid conditions, forecasts, and external drivers like weather and exchanges. Data is scattered across sources with no unified view.
Data delivery models does not match your internal architecture. You may need data in your cloud (Azure, AWS, GCP, Snowflake), but vendors force you through intermediate pipelines or proprietary systems. Latency suffers. Flexibility suffers.
Historical depth is limited. Competitors offer months or a few years of data. For quantitative models, simulations, and backtesting, you need decades of trusted, reliable data streams.
One solution. Five delivery models
Different teams consume data differently. A quant backfill does not look like a real-time trading workflow. DataHub supports different use cases without forcing you into a single access pattern.
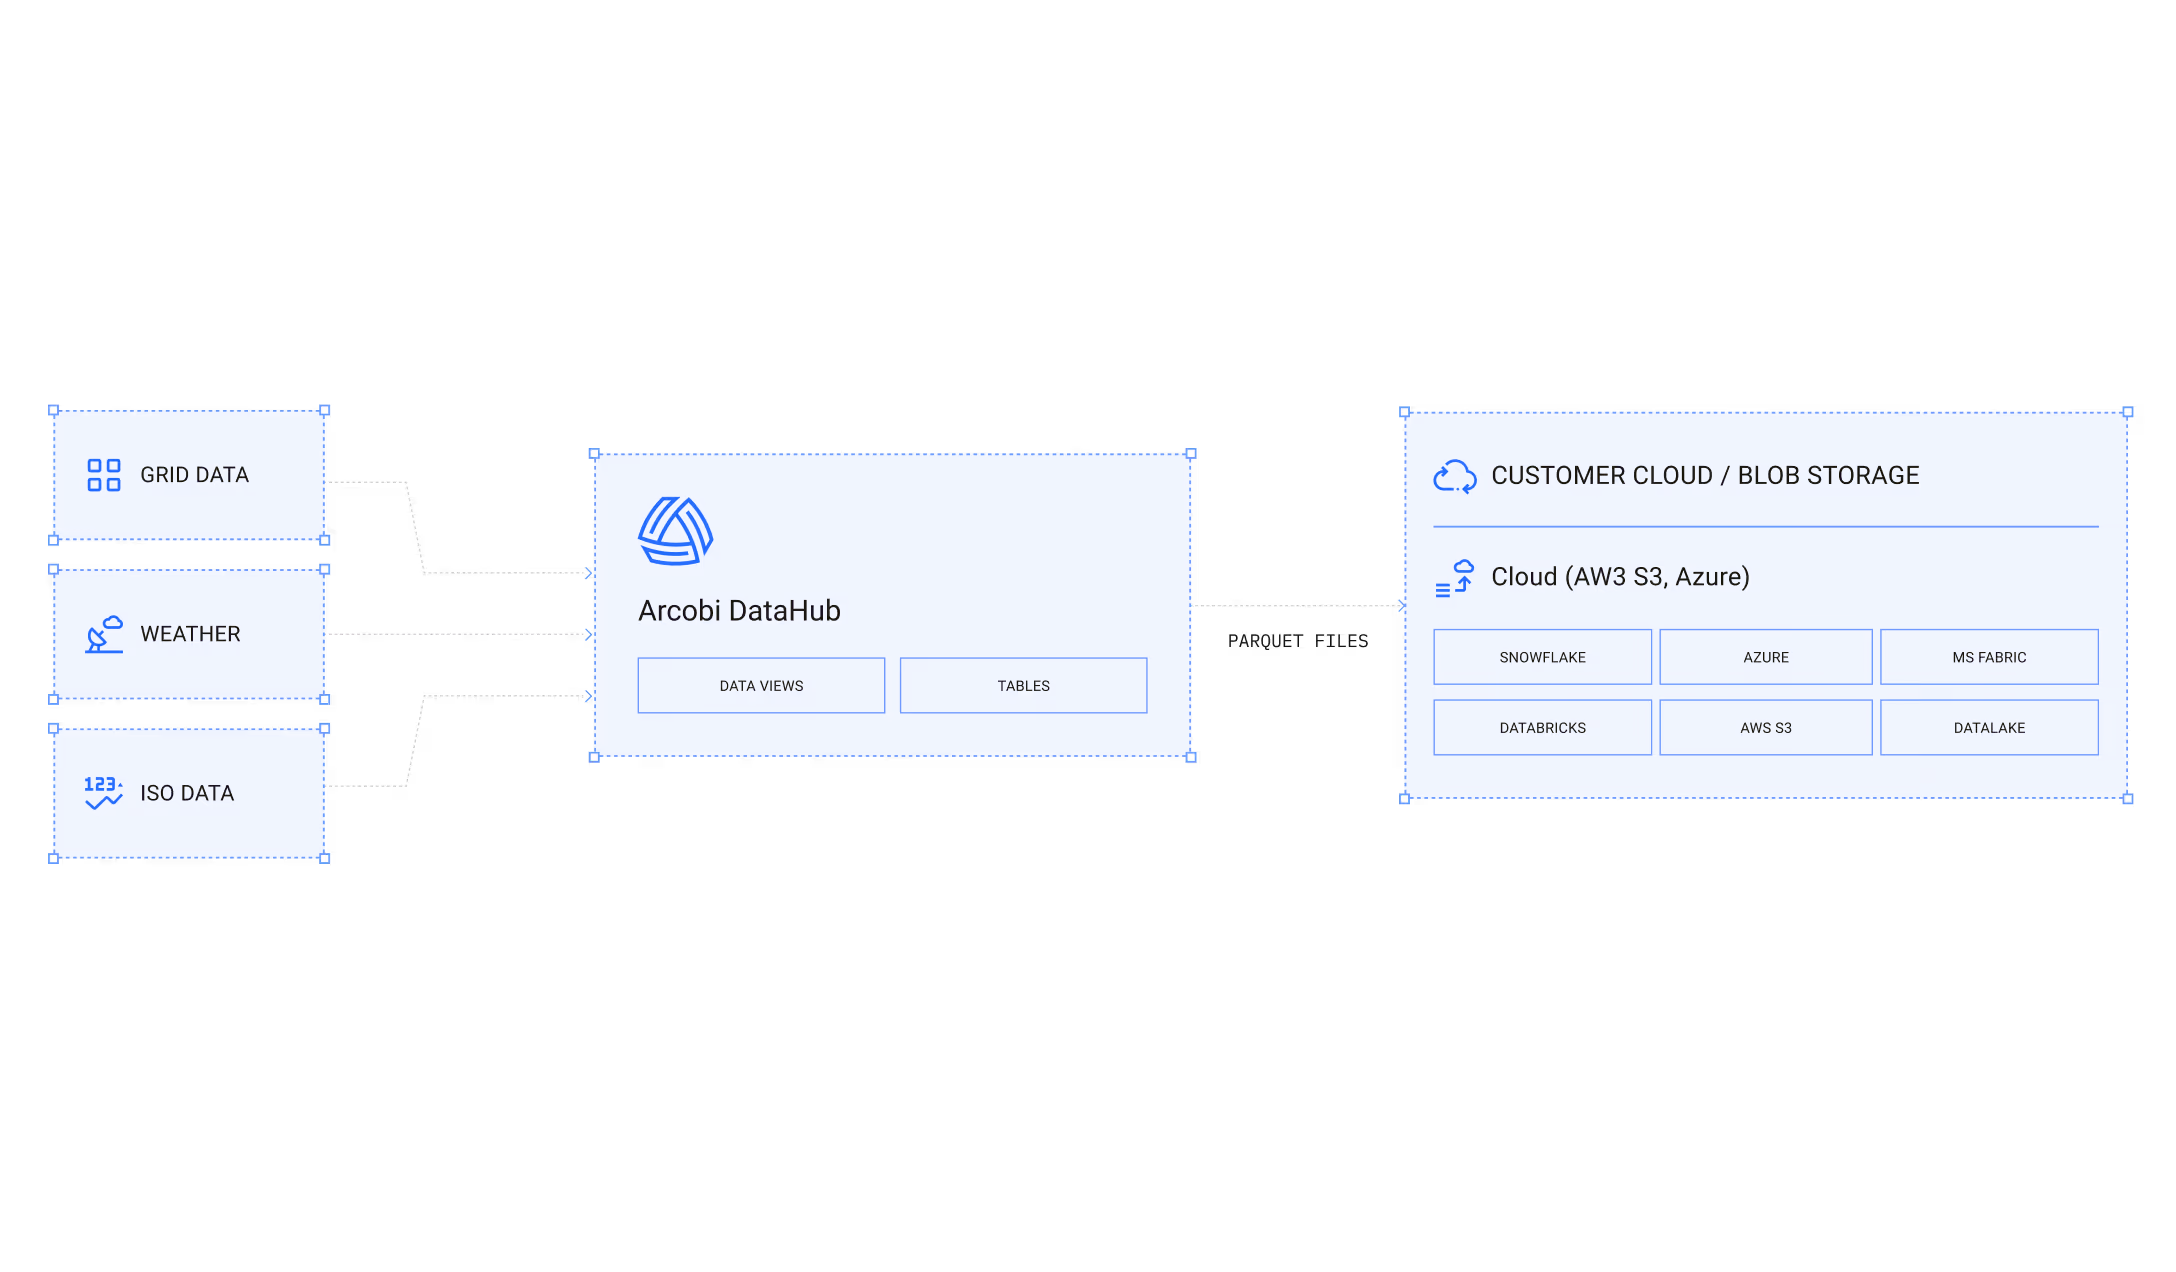
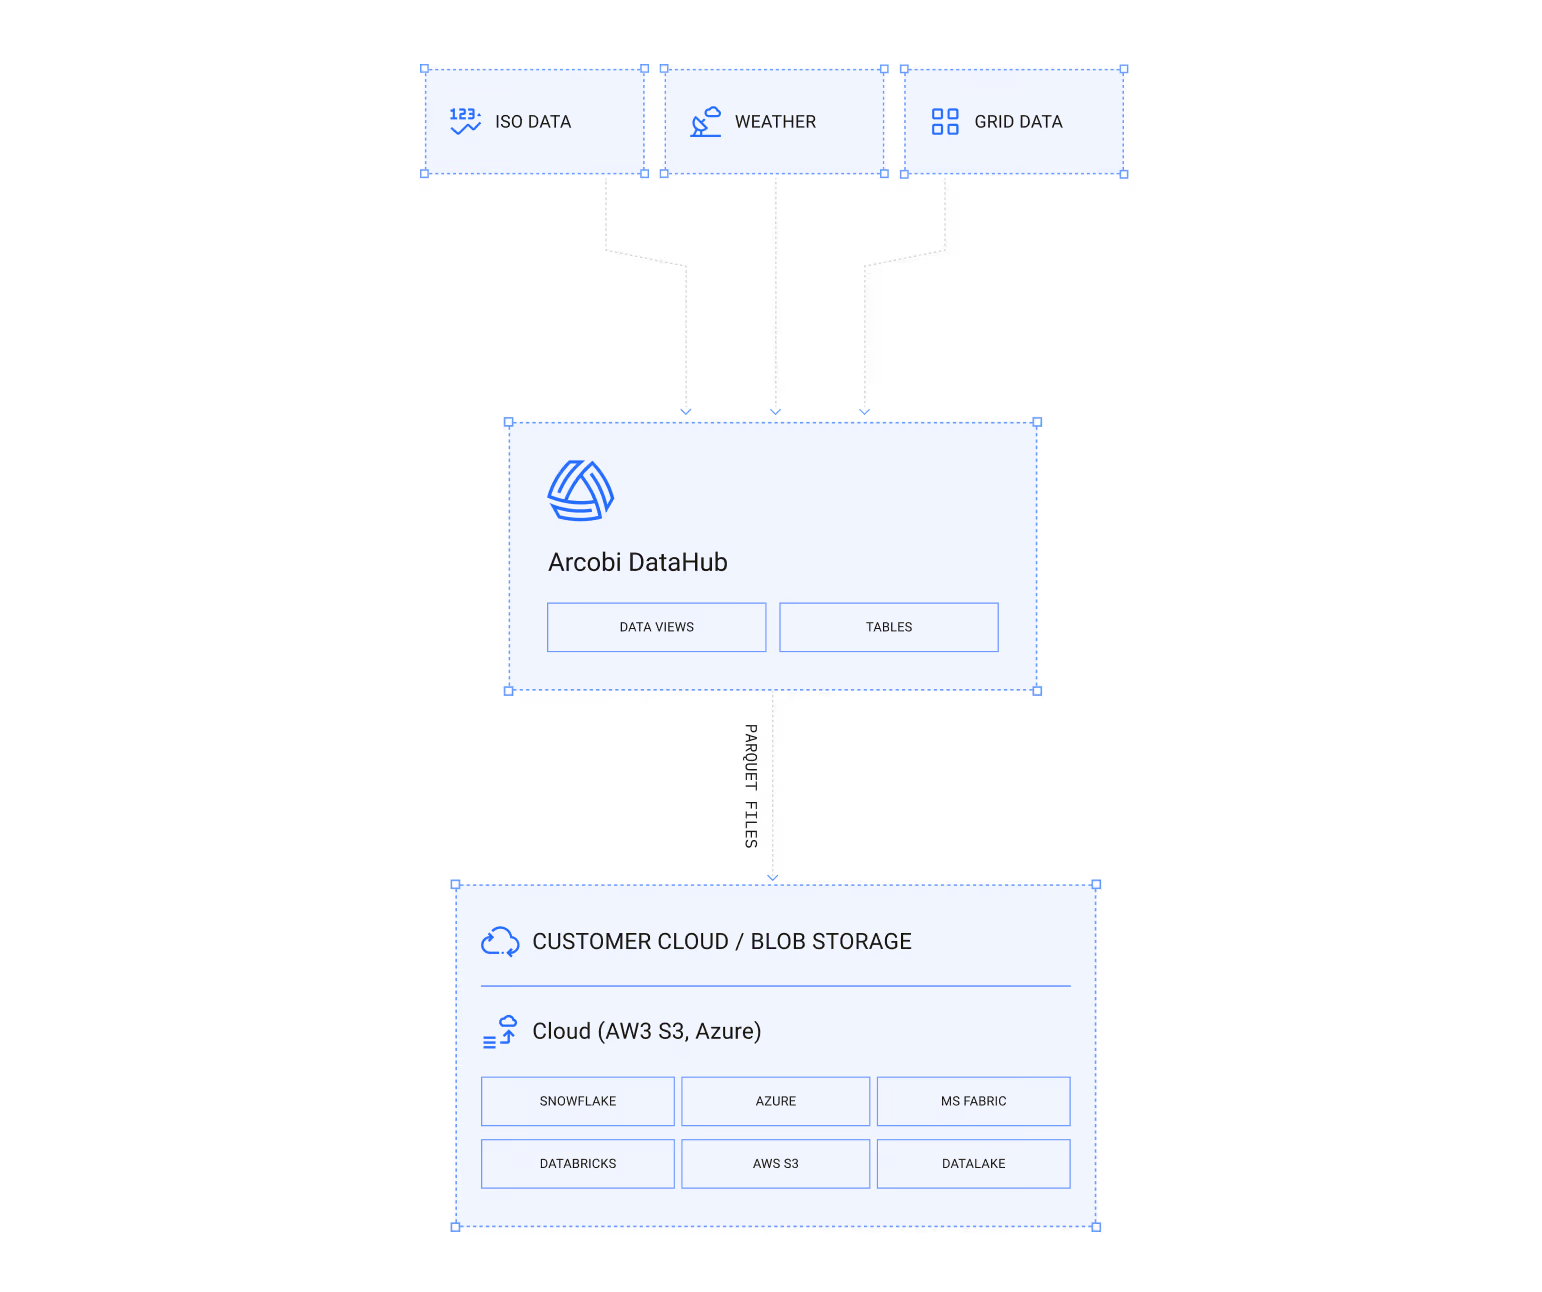
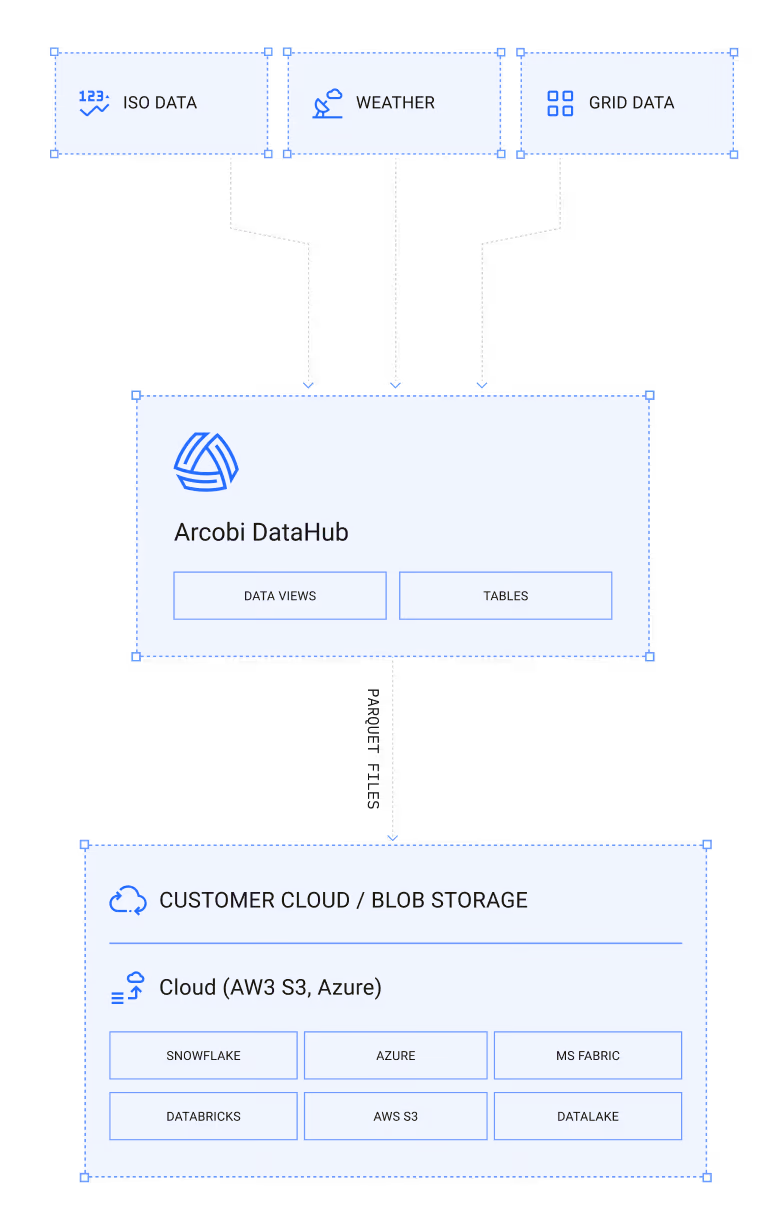
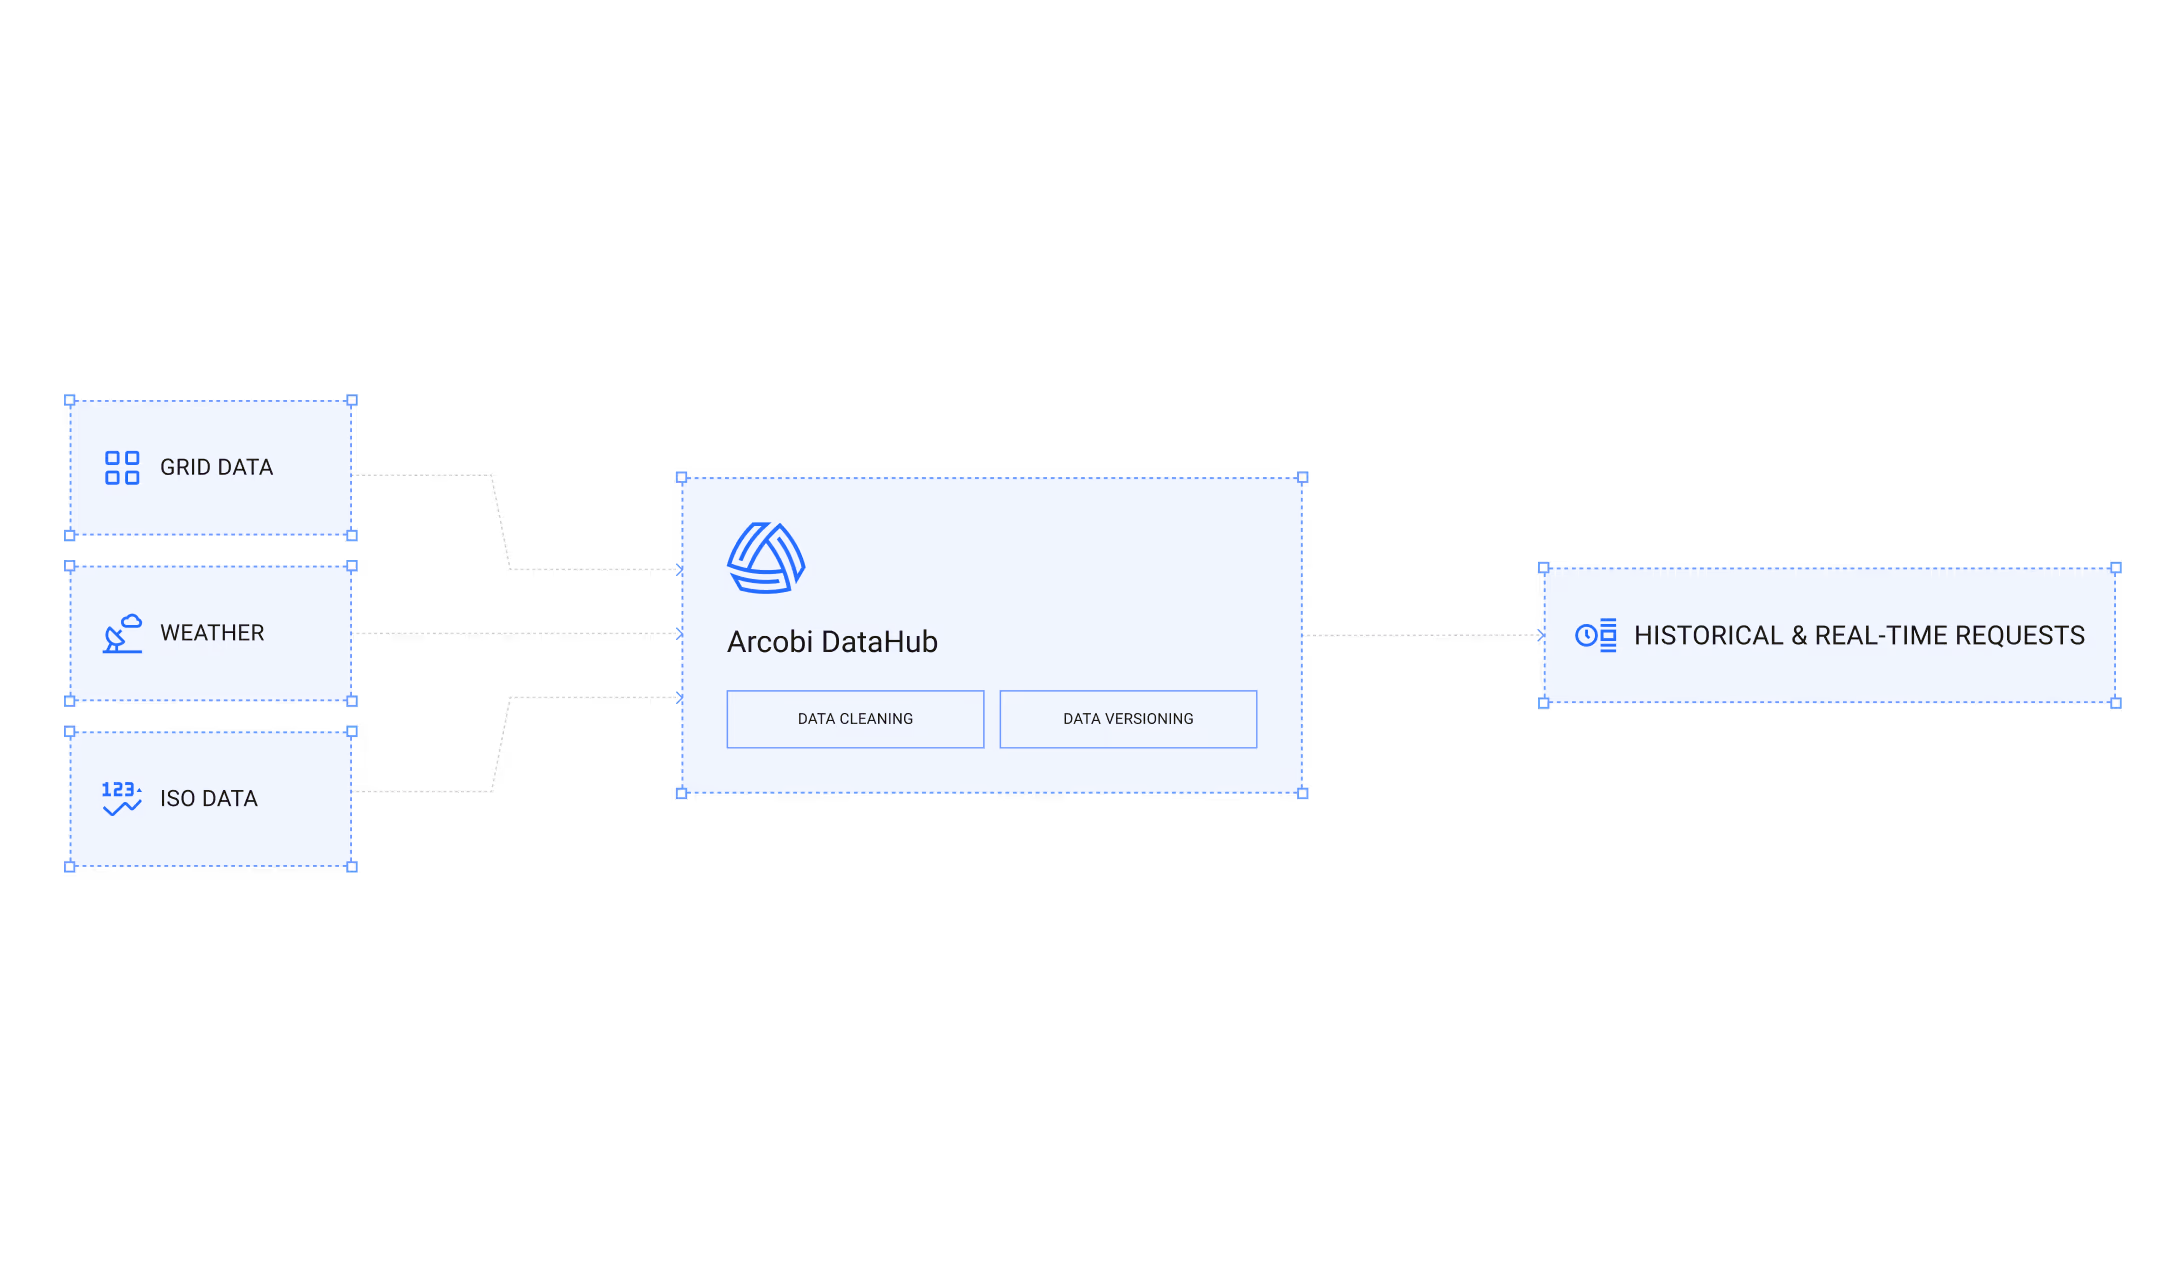
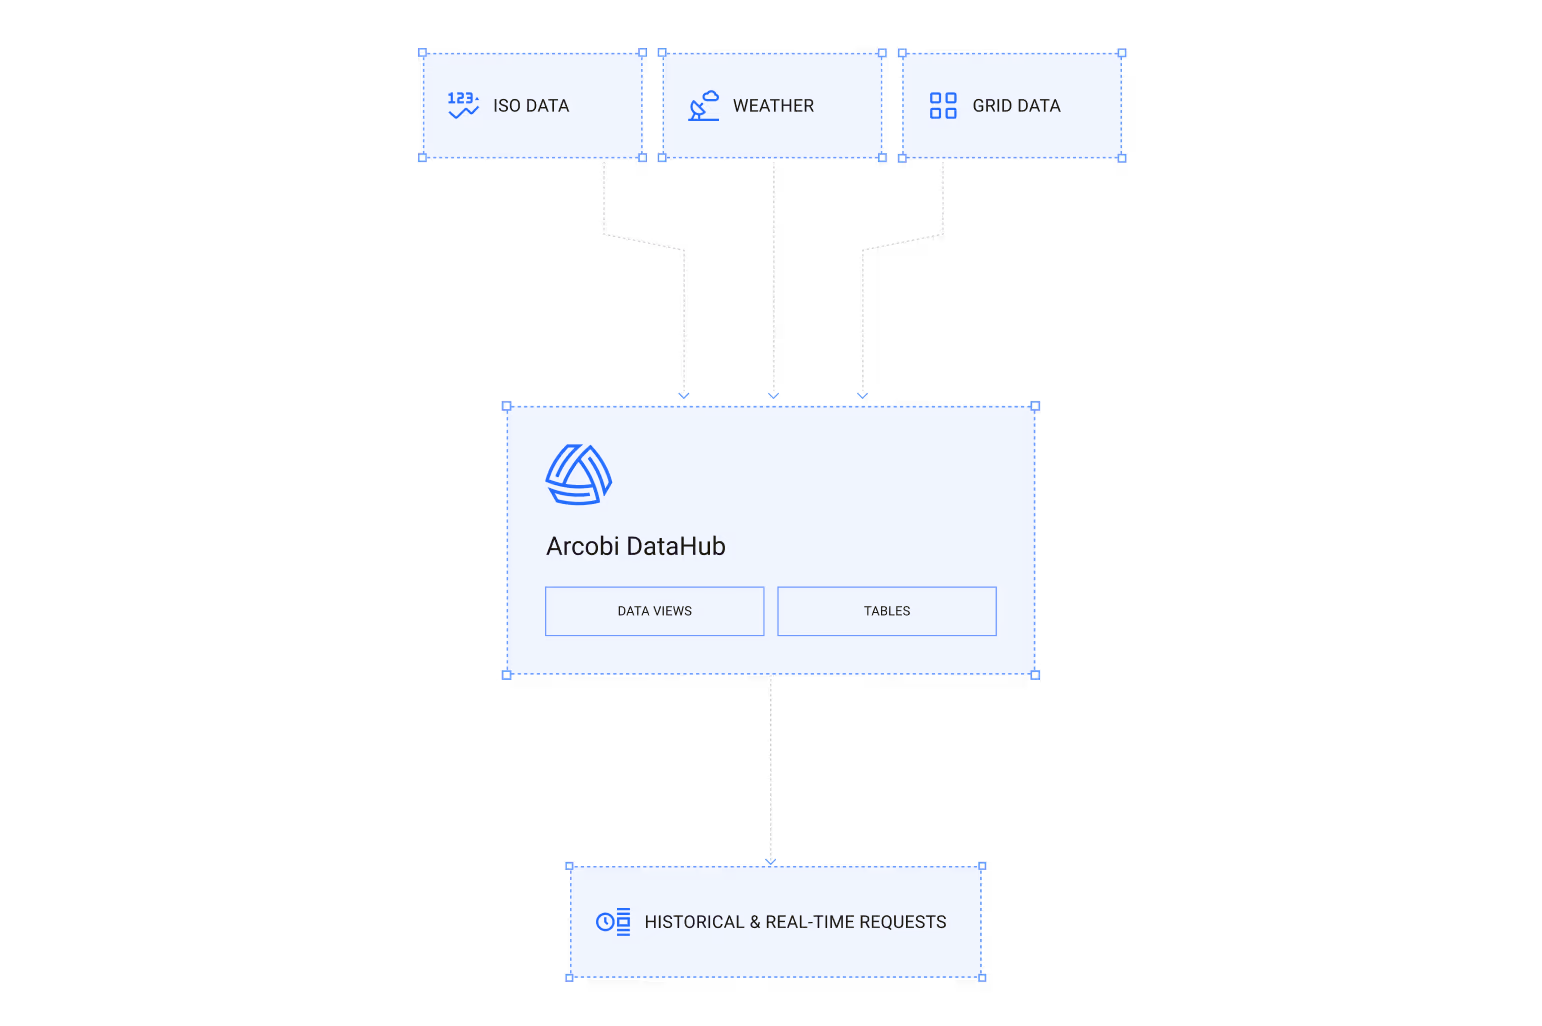

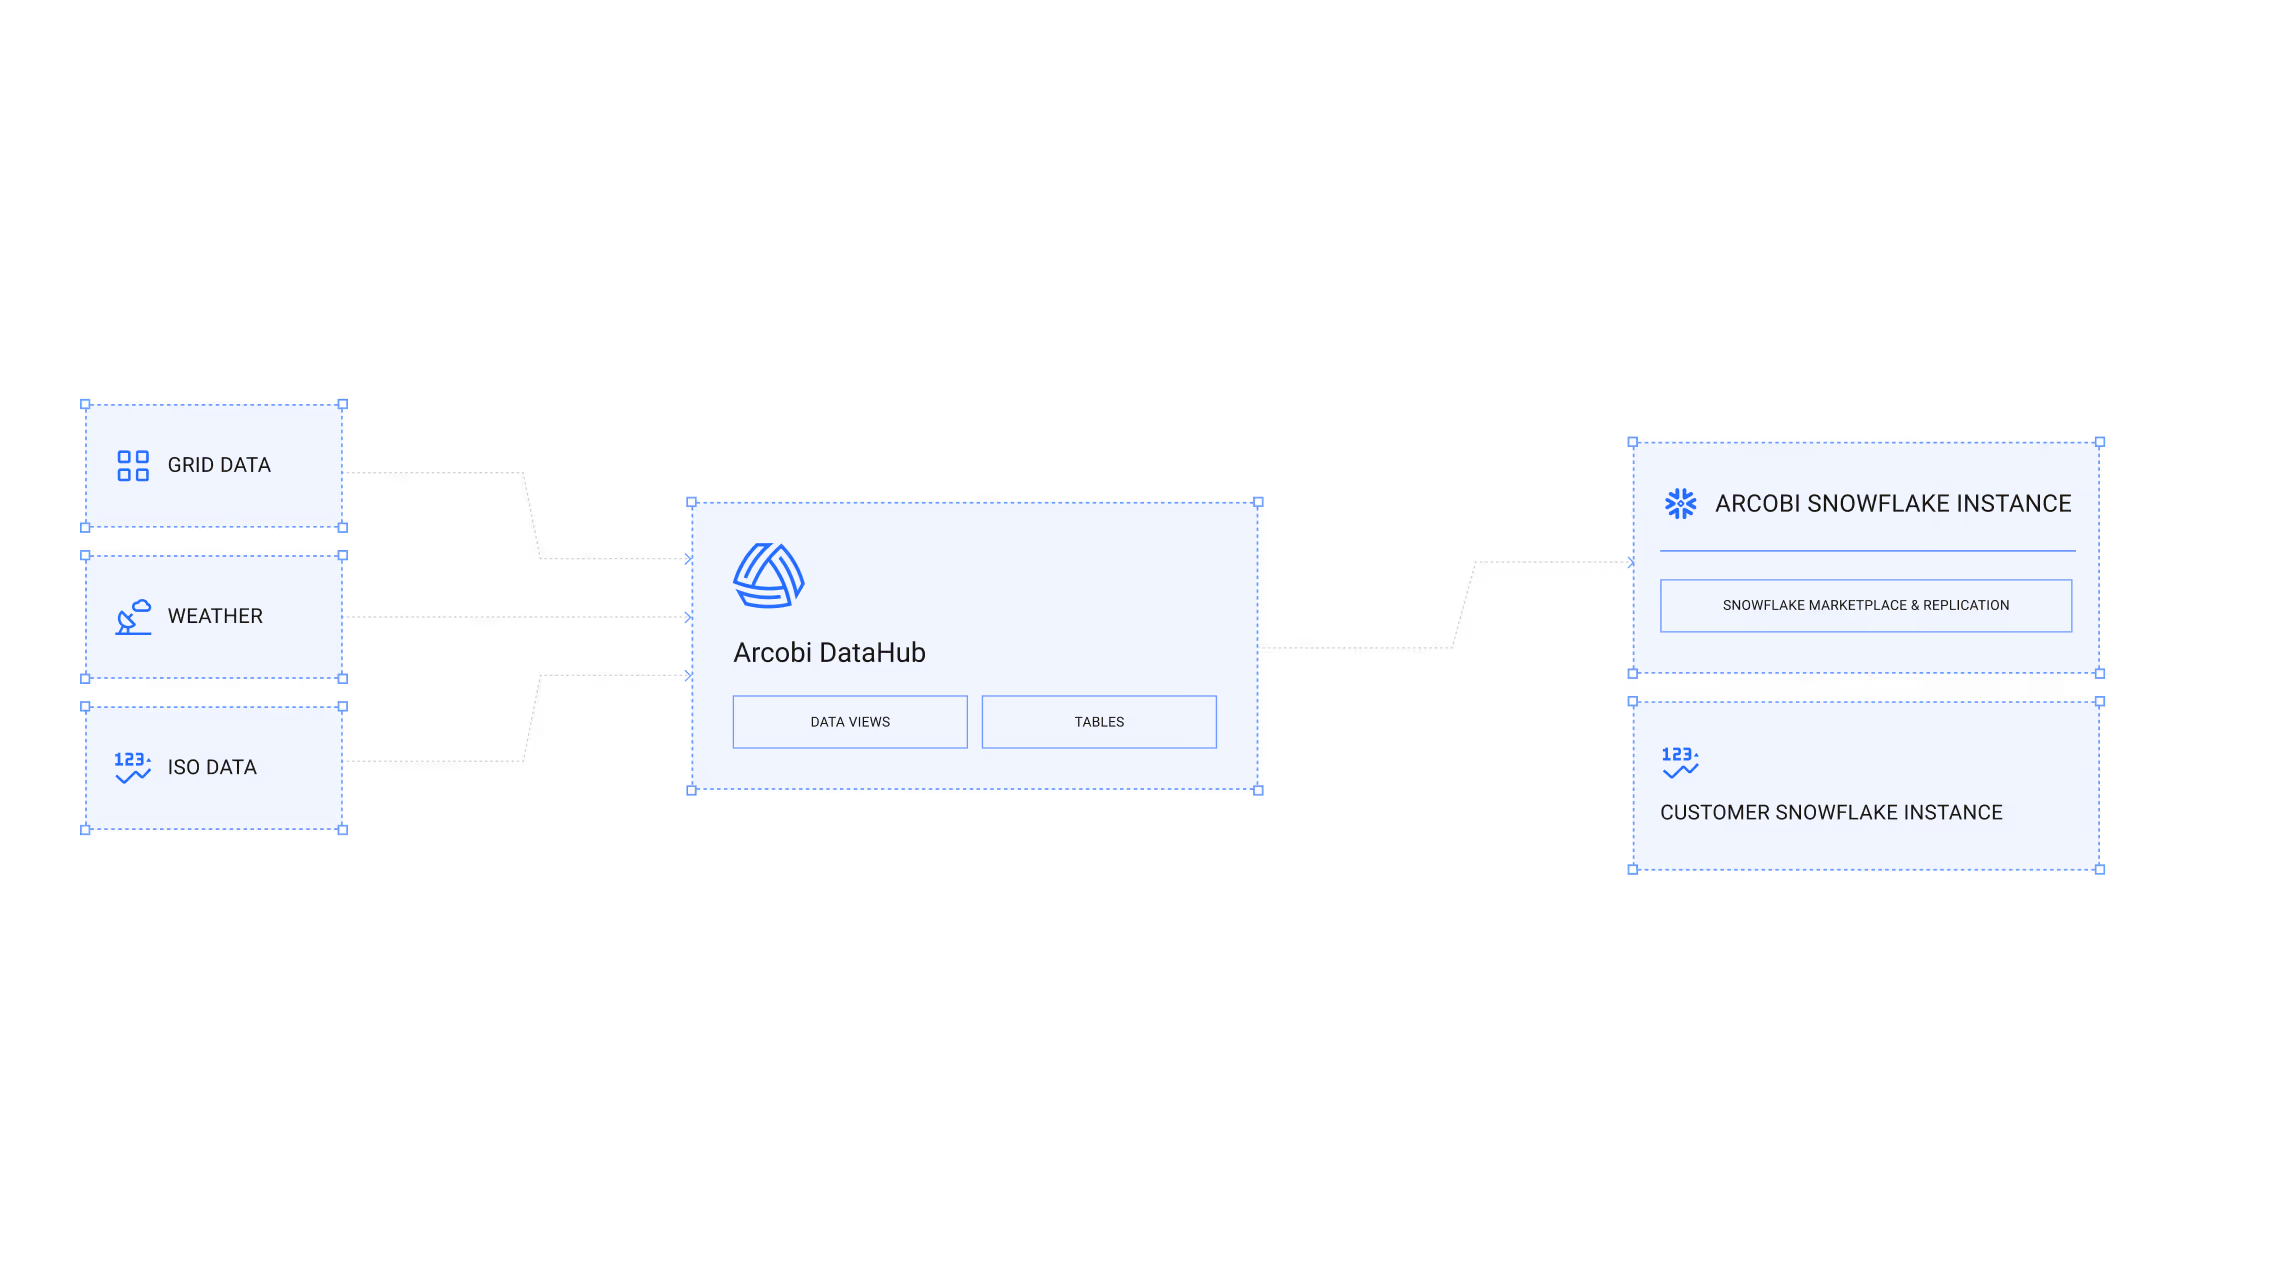
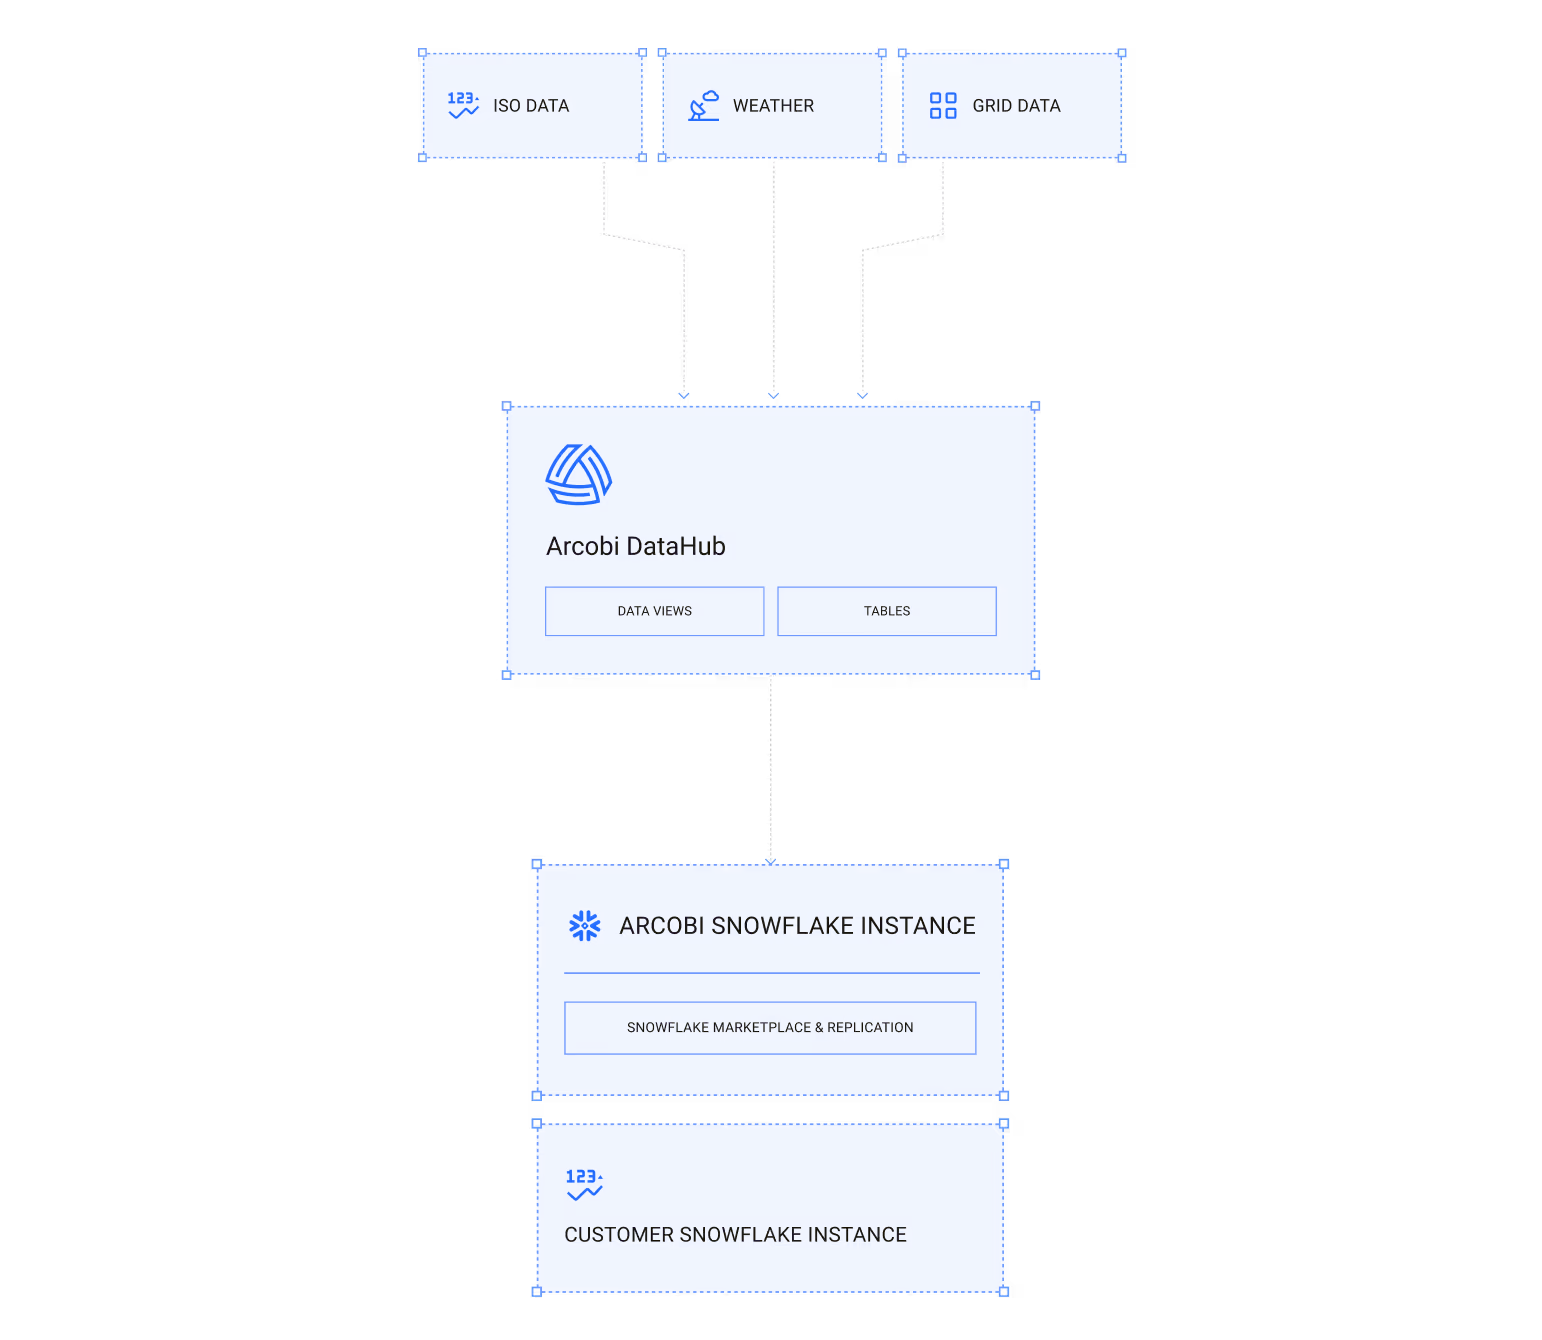
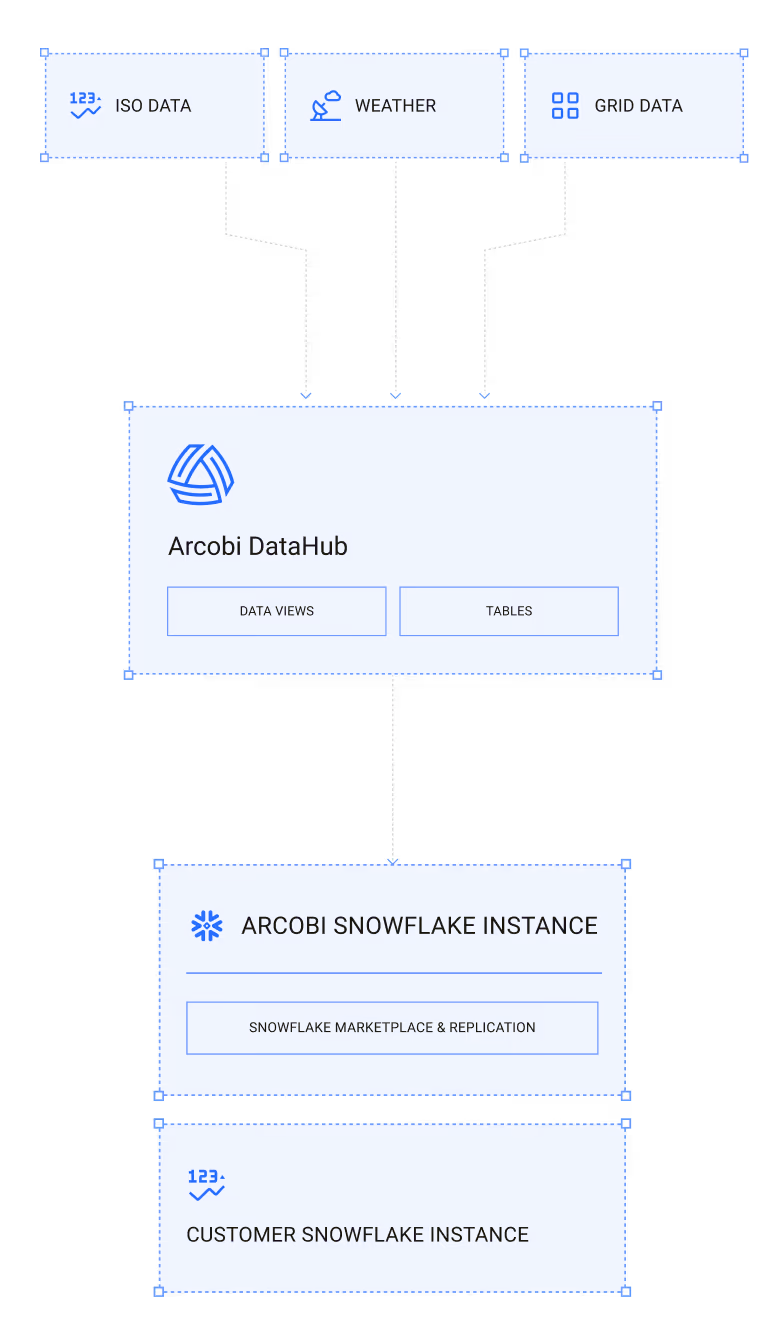
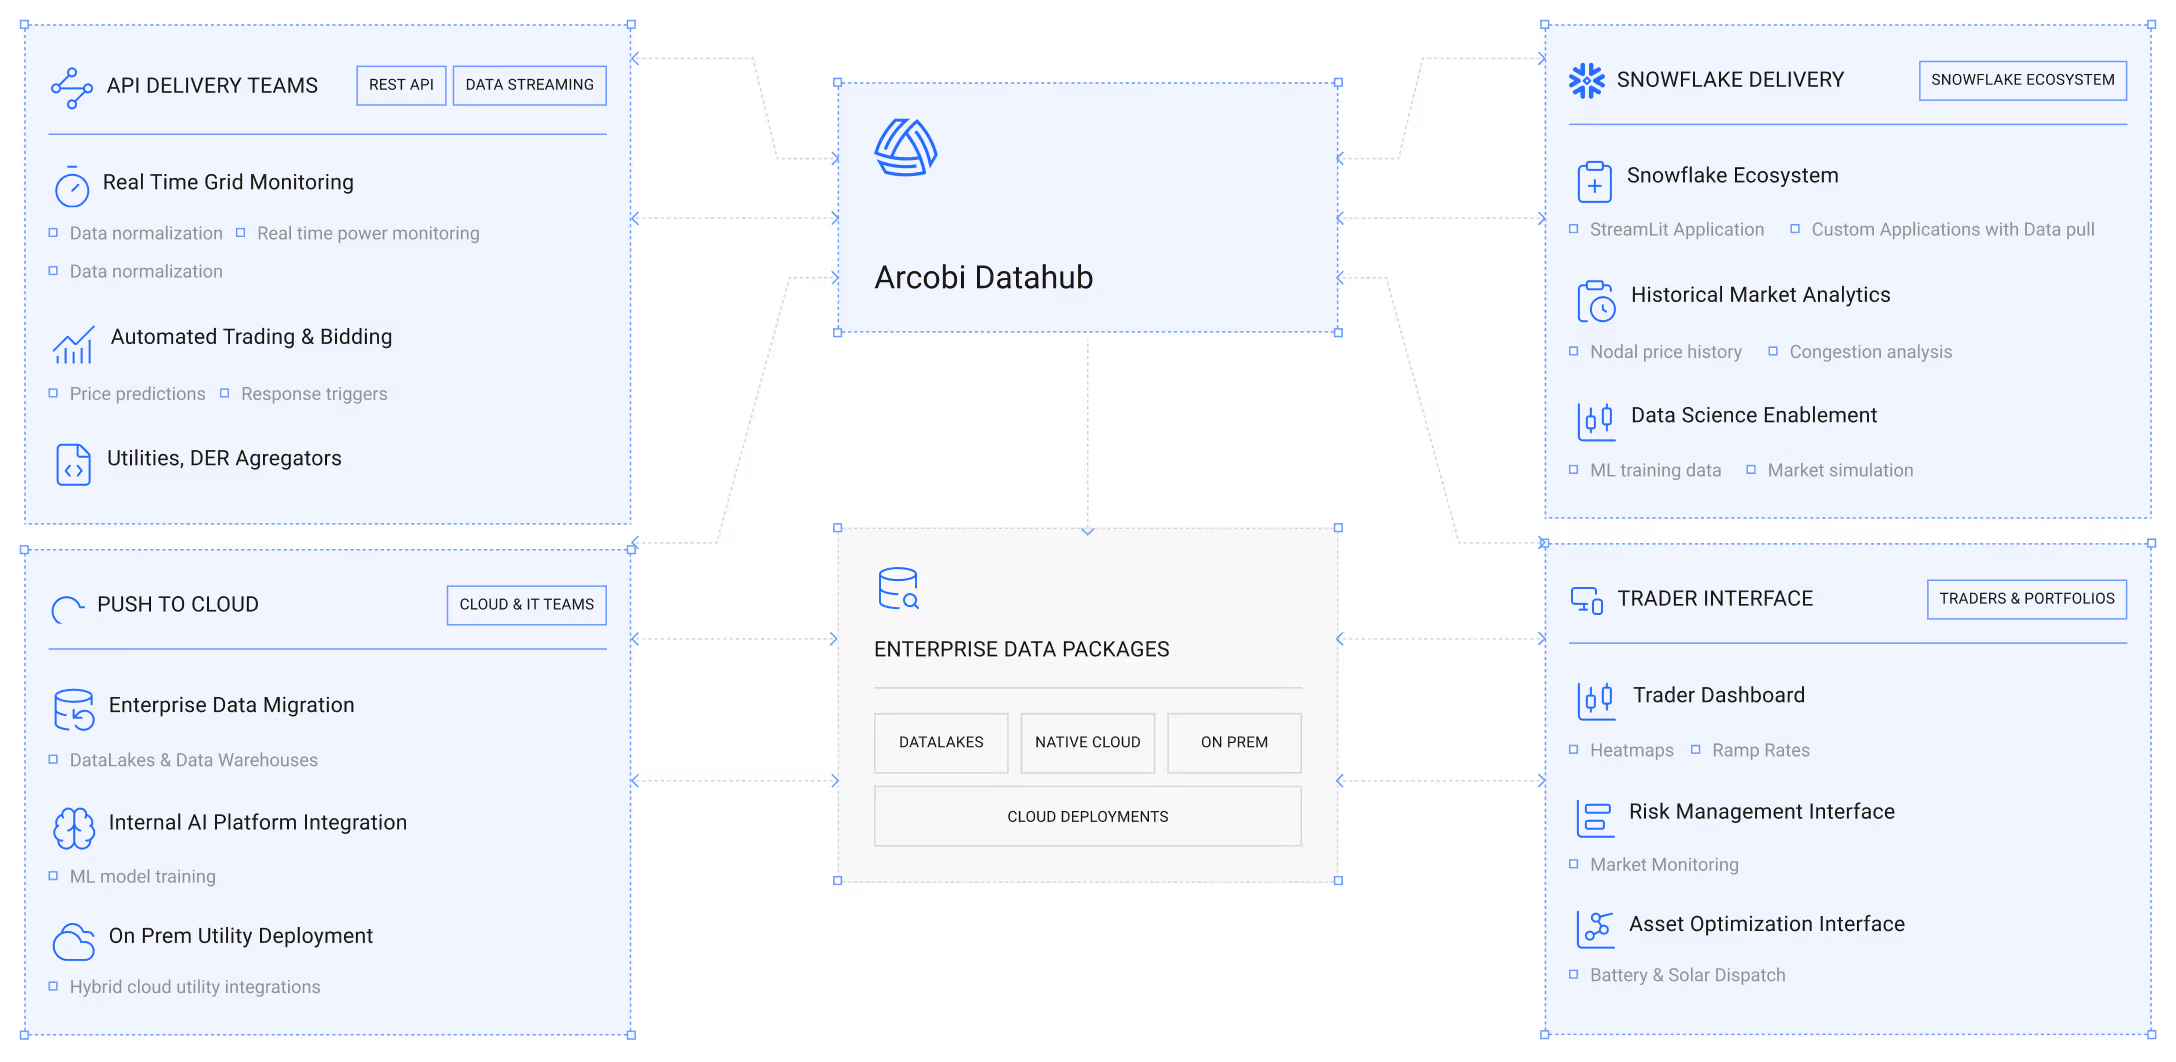
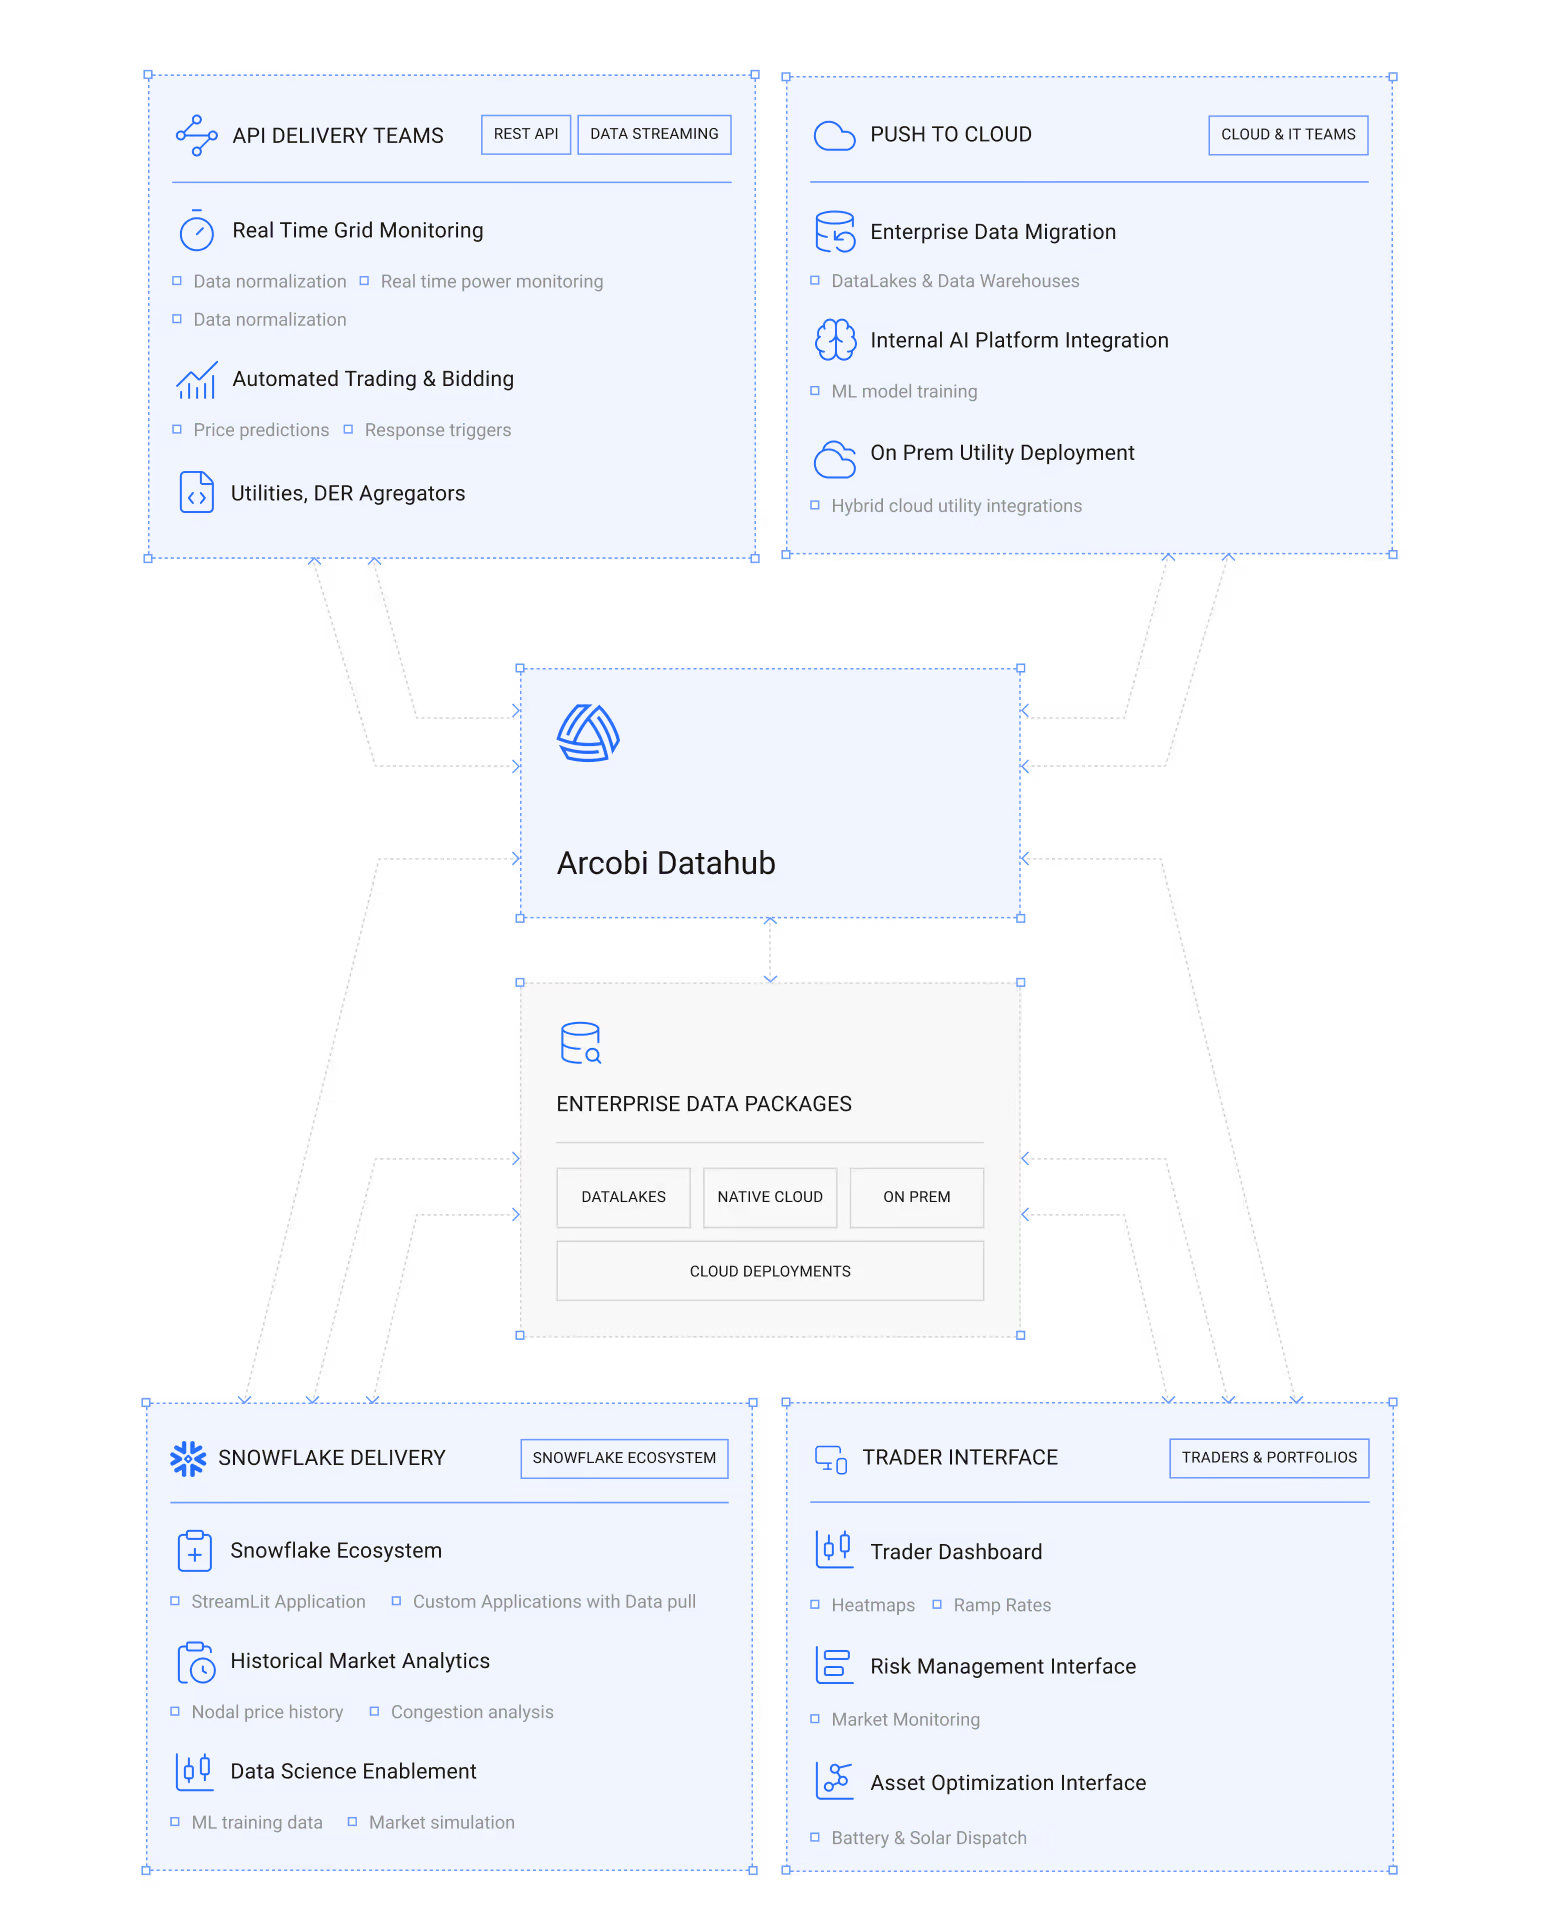
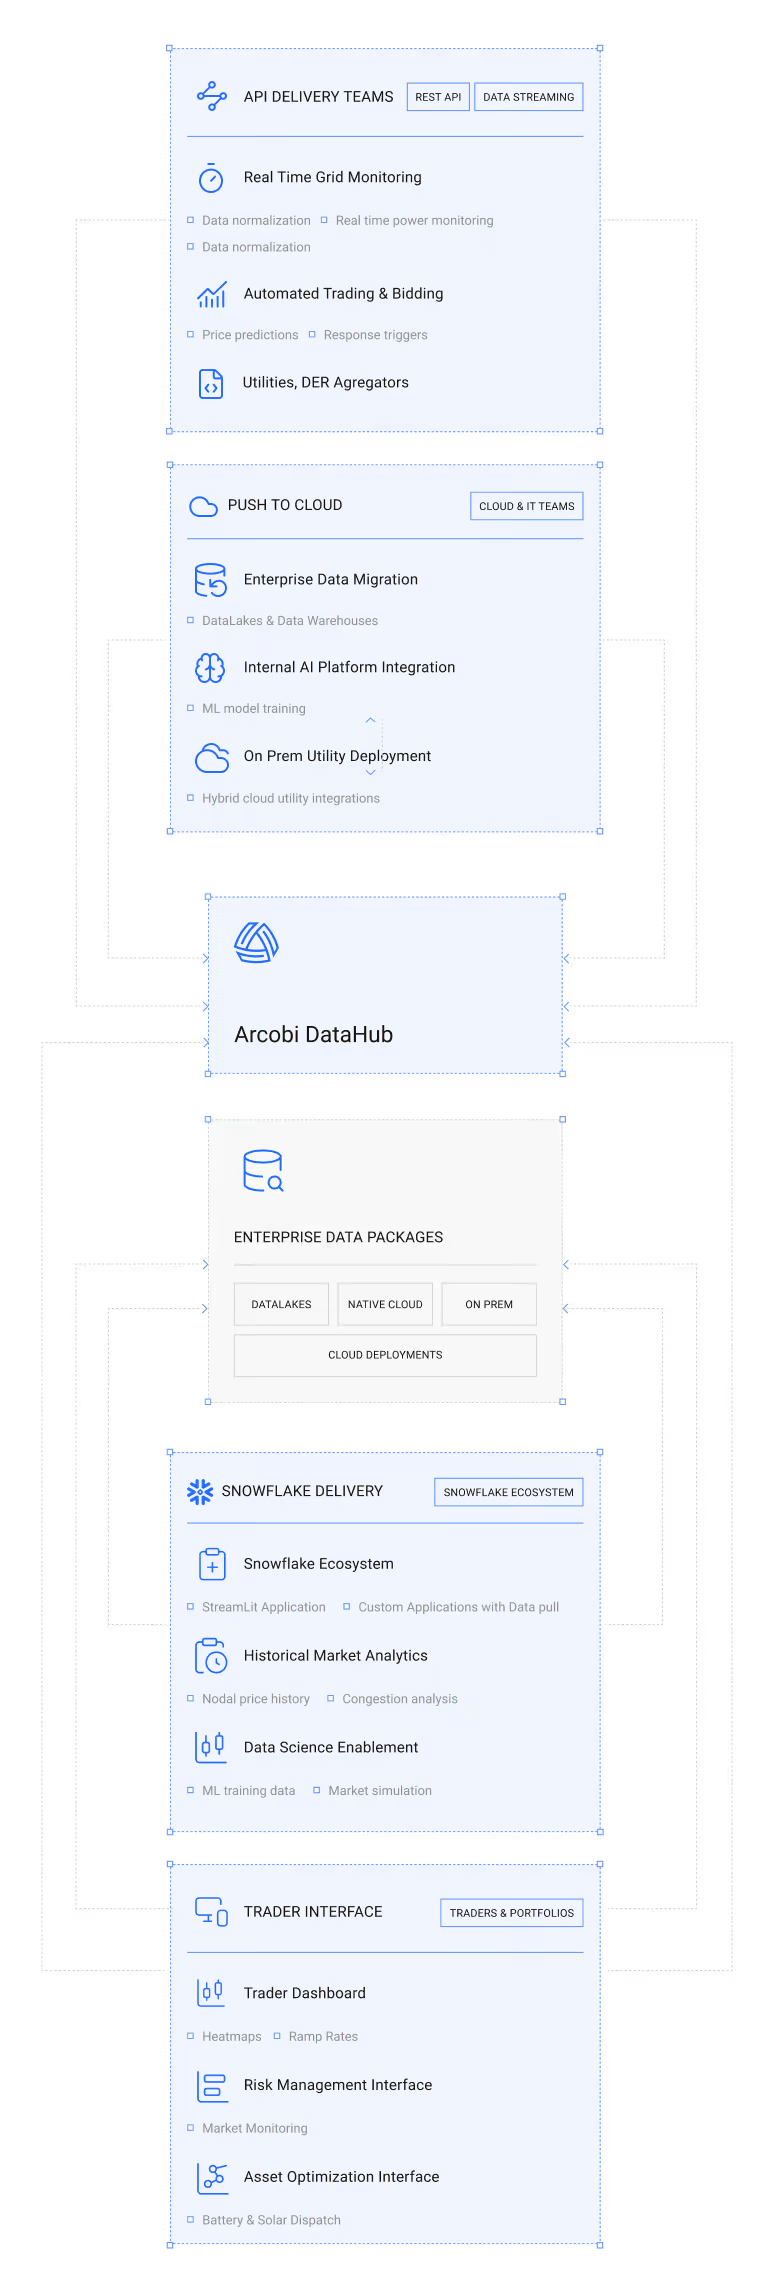
What is DataHub?
DataHub is a low-latency, power market data delivery solution designed to meet your use cases without disrupting your internal data architecture. You can access and run data it in five ways, without changing the underlying data foundation.
Scale
25+ years of historical and real-time data. All North American ISOs. The most detailed, comprehensive power market data repository available.
Speed
Power Market data can be delivered in seconds and minutes. Push-to-cloud and API architecture handles massive data volumes with minimal latency.
Simplicity
The delivered data is fully managed with Zero burden on your ops team. We handle sync, schema evolution, and backfills, ready for analysis and modelling.
Database & Analysis
Five flexible delivery methods: Push-to-cloud, Snowflake Marketplace, API, dashboards, and Excel extractions. Access data however you need it to fit into your custom data environment.
Data Coverage
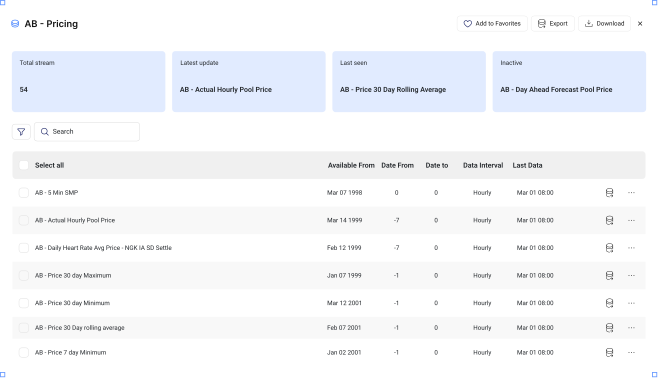
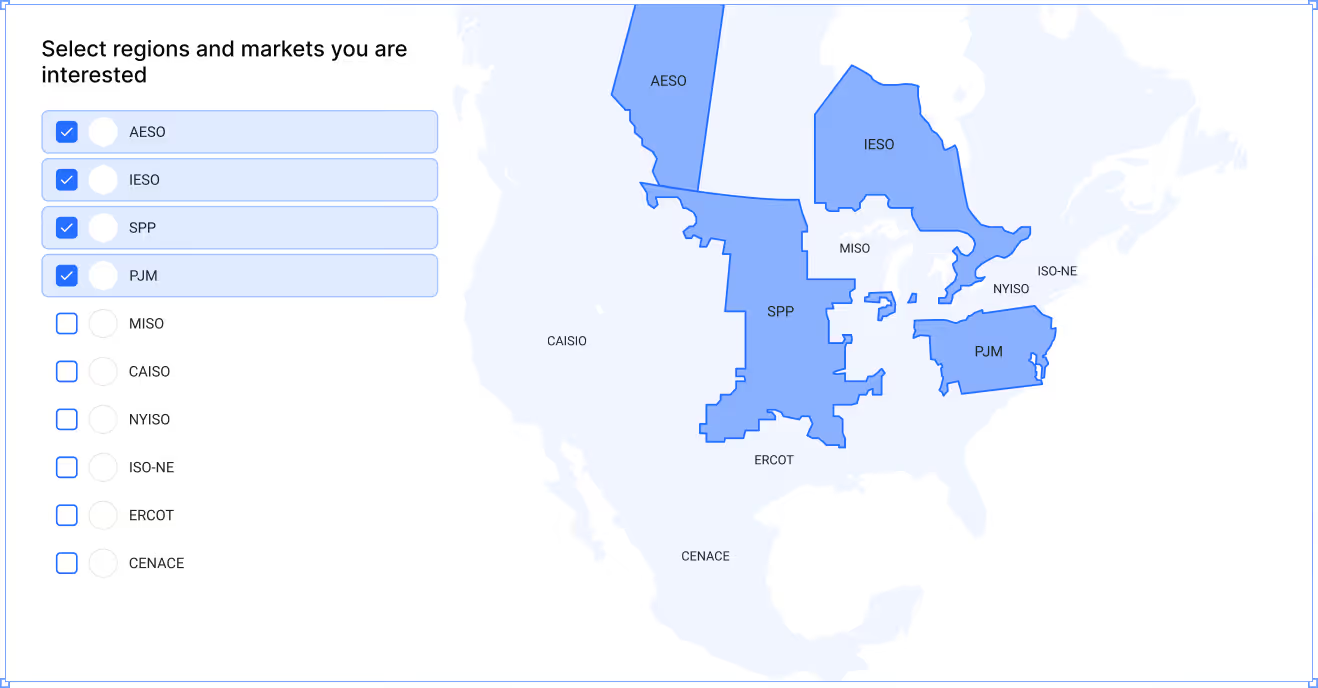
- All North American ISOs: ERCOT, AESO, CAISO, PJM, MISO, NYISO, SPP, ISO-NE, IESO, CENACE. Plus FERC, NERC, WECC regions.
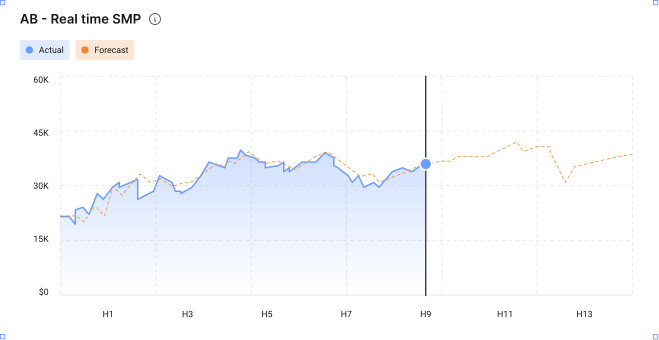
DataHub covers the data layers teams actually use when they build price models, congestion logic, and risk portfolios.
You get that in open formats (CSV, JSON, Parquet, Snowflake and others) so your team keeps control of tools, data governance, and downstream architecture.
Prices and Market Outcomes
RTM/DAM series and related market outputs for backtesting and attribution.
Grid and Congestion
Transmission and congestion datasets to explain nodal and market behavior.
Market Fundamentals
Demand and generation datasets, plus operational drivers like outages, heat rates, and ramp rates and much more.
External Drivers
Weather and exchange-related signals needed for forecasting and scenario analysis.
Who is it for
Built for teams that trade, model, and productize data.

Optimize trading with real-time, comprehensive ISO and ancillary market insights. Access the historical depth needed for backtesting strategies.

Access 100+ billion rows of historical data for model development, forecasting, and trend analysis. Clean, structured, analysis-ready.

Navigate market dynamics with granular data for strategic planning, sizing, siting, and asset optimization.

Manage costs effectively with detailed forecasts and operational insights. Make decisions in minutes, not hours.

Build applications and analytics platforms on top of DataHub. Open access with no vendor lock-in in your cloud enviroment or data warehouse.

If you use Snowflake, pull Arcus Power datasets directly from Snowflake Marketplace and query immediately. Snowflake's compute handles large time-series history without burdening your IT team.
Trusted by Energy Leaders, Proven at Scale
25 years of Power Market Data
150+ Customers
All North American ISOs covered
Trusted by utilities, banks, and Fortune 500 companies
Manufacturing Plant Eliminates $280K in Demand Charges
Facing unpredictable peak demand windows during production cycles, a mid-sized manufacturer deployed Arcobi's coincident peak forecasting and automated load curtailment to cut annual demand charges by 85% without impacting output.









Turn uncertainty into opportunity
See the market clearly, predict what’s next, and control outcomes. Data, forecasts, and asset intelligence in one place.