Your Energy Costs Are Set by a Handful of Hours. Know Which Ones
Short-term price, demand, and coincident peak predictions for North American wholesale electricity markets. Built on 25+ years of comprehensive power market data.
Predictive Intelligence Built for Load Management and Cost Control
AI Price & Demand Forecasts
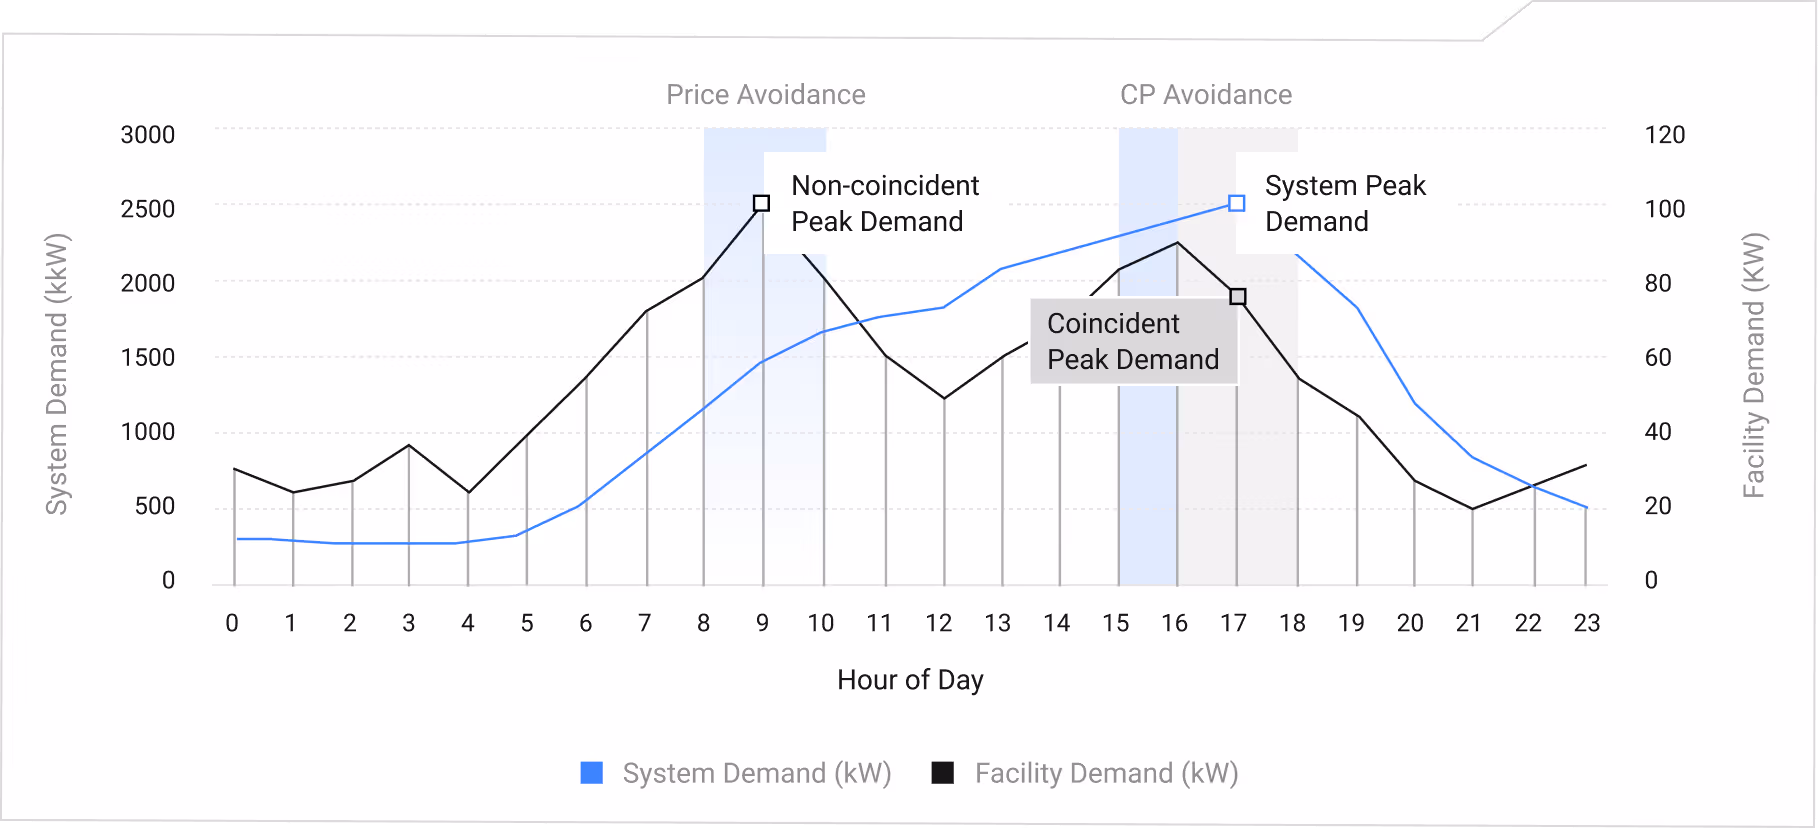
Coincident Peak Identification
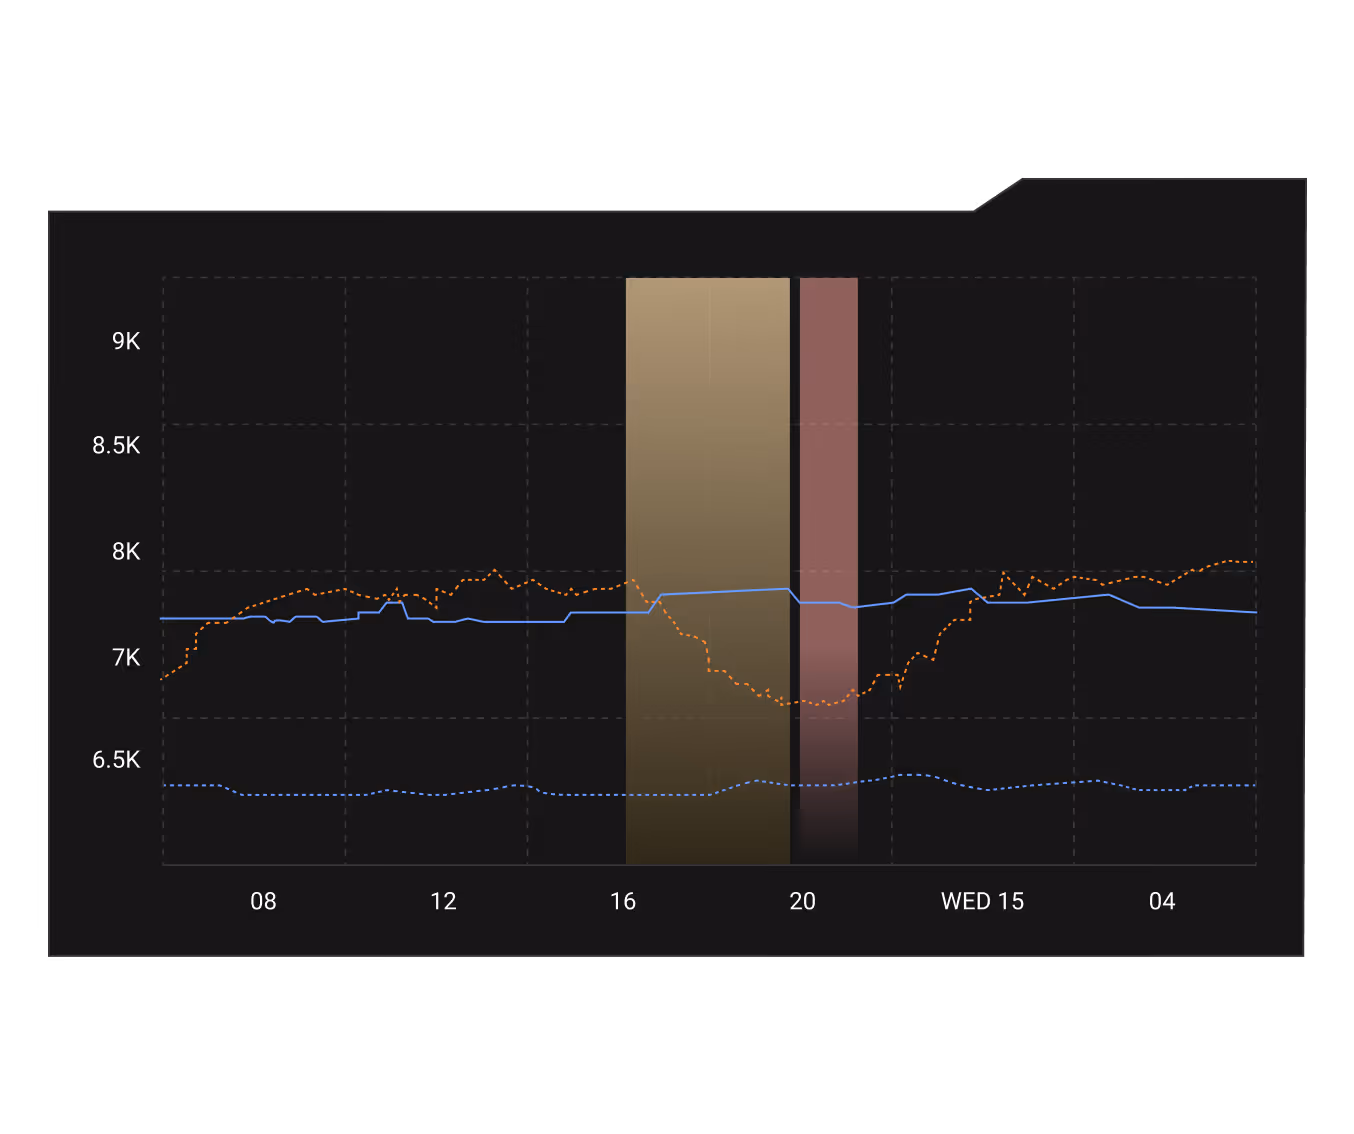
Price Avoidance
Asset Availability & DR
Arcobi AI Forecasting delivers short-term predictions for wholesale electricity prices, system demand, and coincident peak probability across major North American power markets.
Dashboards
Email & SMS Alerts
REST API
Analyst Reports
Forecasts run on models trained against 25+ years of proprietary market data, direct weather instrumentation, and market participant behavior signals that go beyond standard ISO feeds.
The result: intelligence that reaches your team with enough lead time to act — through dashboards, API, alerts, and scheduled analyst reports.
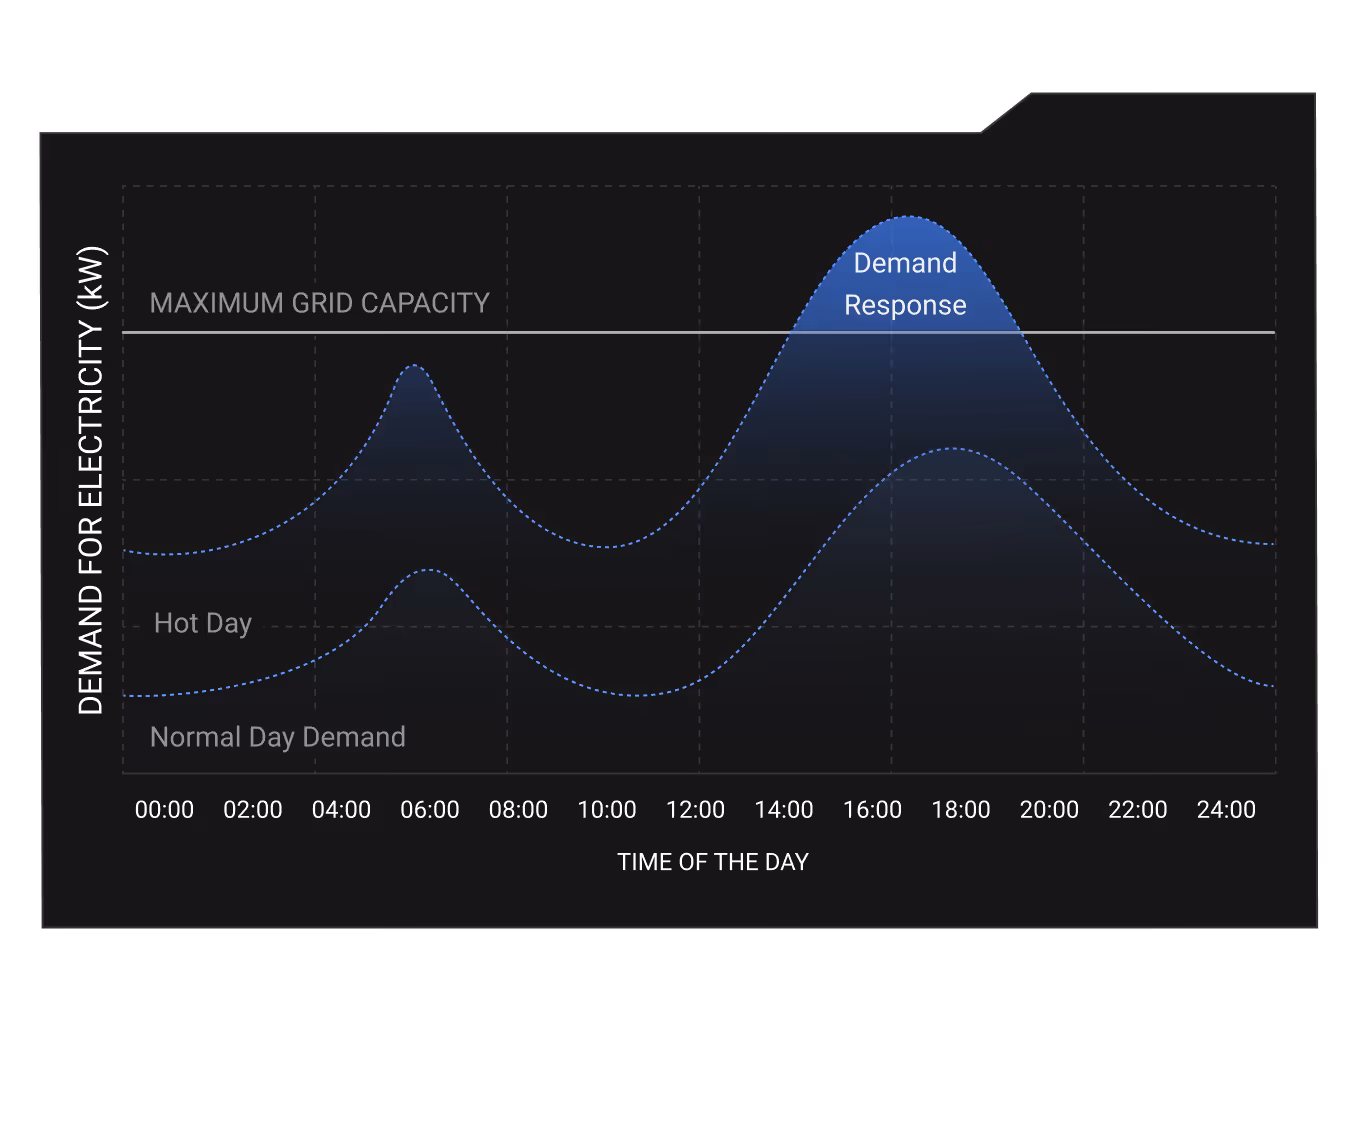
A Few Hours Determine Your Energy Bill for the Next Year
These are specific, measurable losses. Accurate forecasting with enough lead time to act eliminates most of them.
Miss the Window, Pay the Price
Coincident peaks fall in narrow, unpredictable windows. Miss the call and you pay high transmission rates for the entire rate period.
Price Spikes Don’t Wait
Act too late on a price spike and avoidable cost exposure hits your bottom line. Wholesale prices fluctuate without warning.
Unused Capacity Is Lost Revenue
Miss a demand response window, and the revenue your assets were already qualified to capture goes elsewhere. Permanently.
One-stop Solution to Manage Risk


- [ 01 ]
Coincident Peaks
A handful of hours each year set your transmission charges for the next 12 months. Miss the call and you pay elevated rates all year. Overcall it and you curtail with no financial benefit.
- [ 02 ]
Real-Time Price Spikes
Wholesale prices move fast and without notice. For large energy consumers and flexible load operators, unhedged exposure to price volatility is one of the most controllable and most overlooked cost drivers.
- [ 03 ]
Demand Response Timing
Participation requires knowing when the grid will call, typically hours in advance. That signal comes from grid condition and demand forecasts, not intuition.
- [ 04 ]
Transmission Charges
Often the largest line item on an energy bill. Determined by consumption during a few specific peak hours. Identifying those hours in advance lets you reduce load and lower the charge directly.
- [ 05 ]
Weather-Driven Load Shifts
Demand shifts with weather, grid events, and pricing signals simultaneously. Organizations managing large or distributed loads need forward visibility to plan operations, not just a view of what already happened.
- [ 06 ]
Disconnected Workflows
Forecasts produced in one tool, acted on in another. Every handoff adds delay, and delay erodes the value of the forecast. A single pipeline from prediction to execution eliminates that friction entirely.
From Market Data to Operational Decision
Four layers working in sequence, end-to-end.


Data Foundation
25+ years of curated North American market data. Prices, grid metrics, weather, 350,000+ streams. Arcobi originates this data directly.
Predictive Models
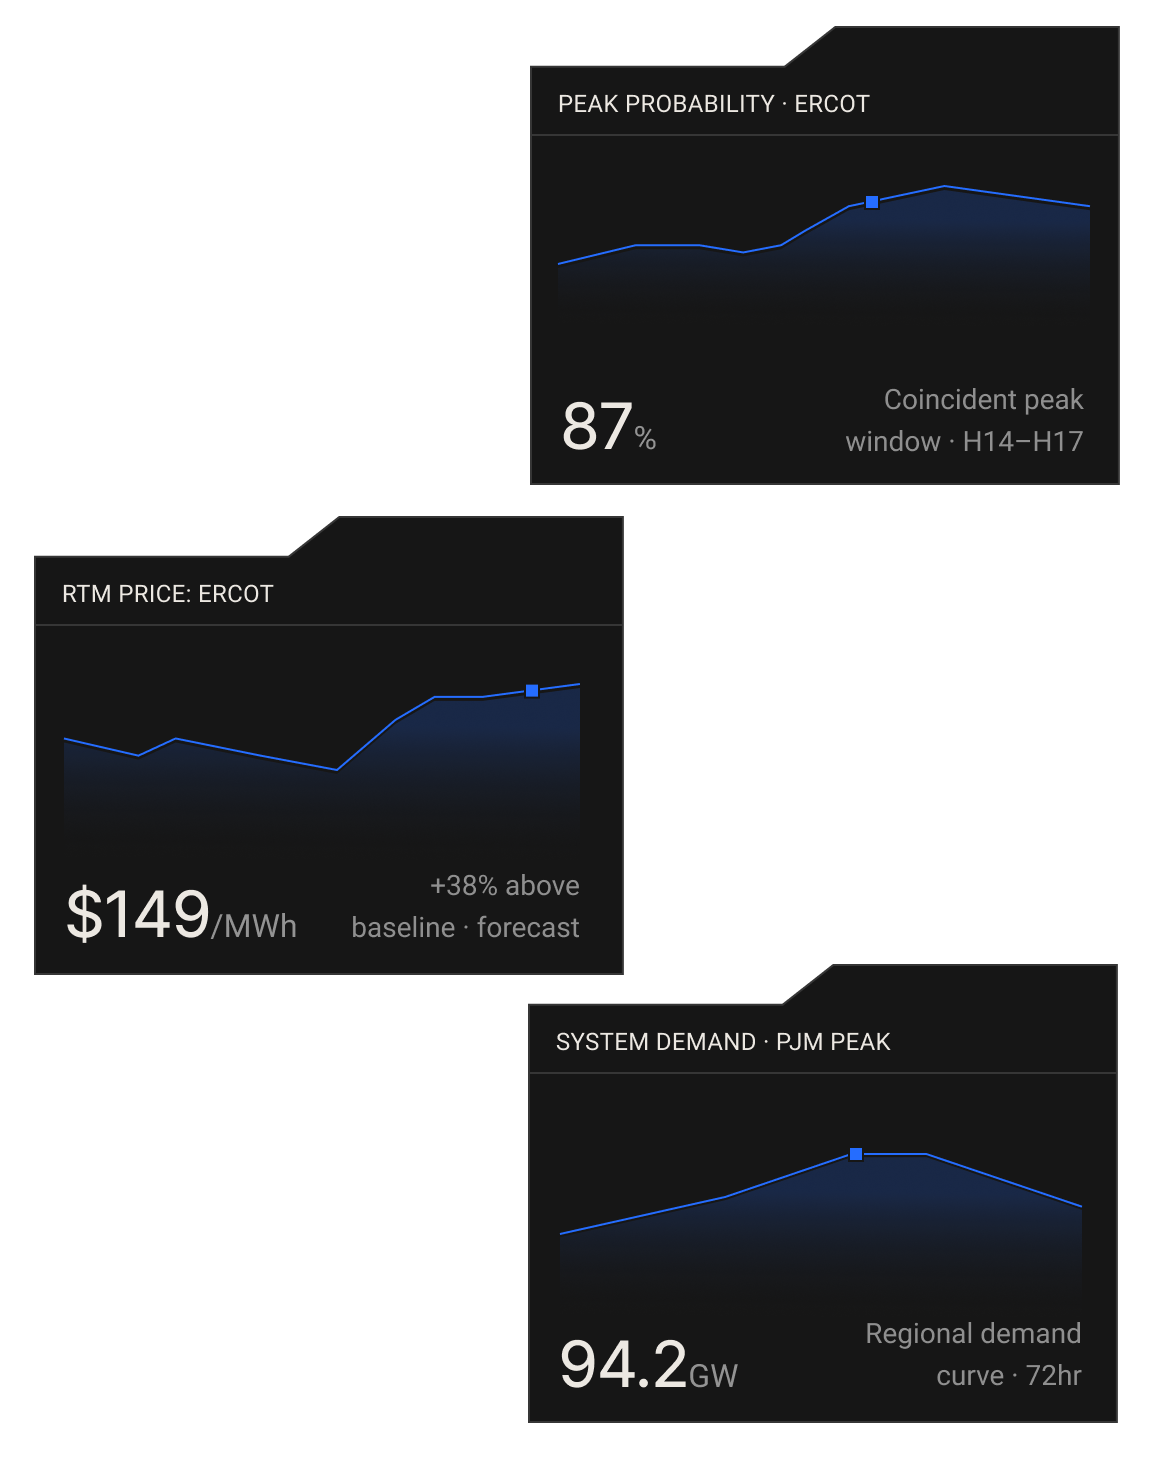
Deep machine learning models train on DataHub's historical and real-time data. They produce short-term forecasts for wholesale market prices, system-level and regional demand curves, and coincident peak predictions with escalating probability scores
Human-on-the-Loop Validation
AI generates the forecasts. Domain experts validate outputs during extreme weather, regulatory interventions, and unplanned outages, catching the edge cases that automation alone misses.

Delivery
Forecasts reach your team through dashboards, REST API, email and SMS alerts, and scheduled analyst reports. One pipeline from forecast to decision.
What You Do With It


Coincident Peaks

Coincident peak windows are narrow and high-consequence.

Peak probability with multi-day advance notice and escalating confidence scores as the window approaches.
Curtail load, deploy storage, or shift operations during predicted peak hours.

Avoided transmission charges for the full rate period.
Transmission Charges
Transmission charges are large and difficult to control.
The specific hours that will determine your transmission rate base.
Target load reduction during those hours.
Direct reduction on one of the largest energy cost line items.
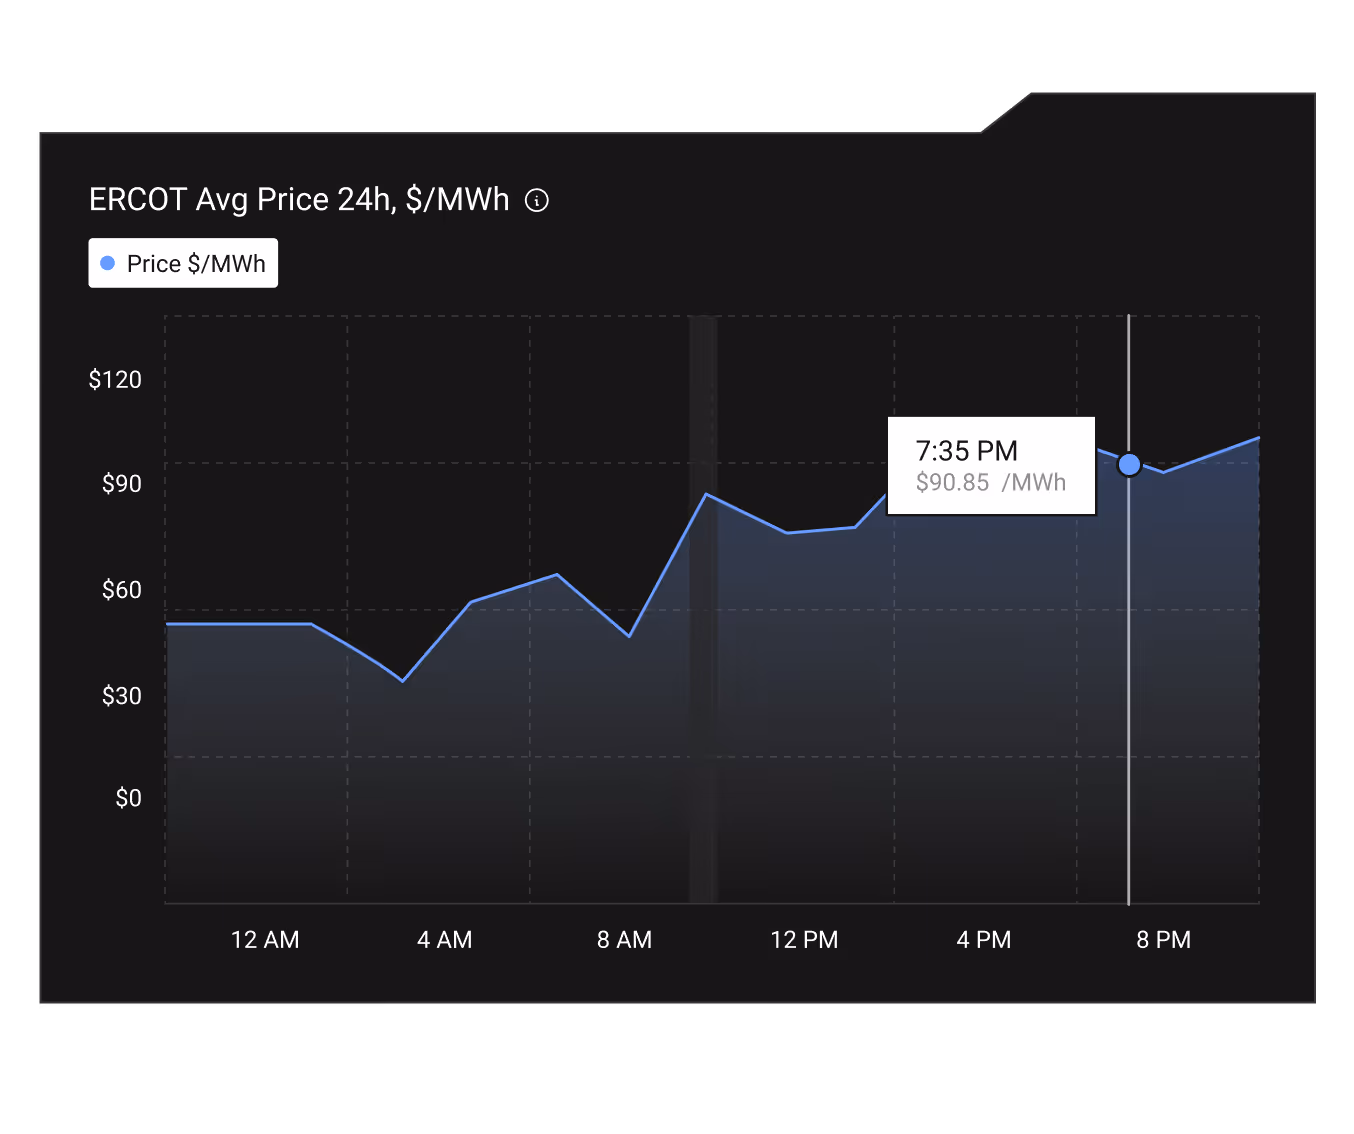
Price Spikes
Real-time price spikes create unplanned cost exposure.
The price direction and magnitude of the upcoming move.
Adjust flexible load or demand response participation before volatility hits.
Lower real-time energy costs.
Response Windows
Demand response windows are hard to anticipate.
Grid conditions that signal when demand response will be called.
Pre-position flexible assets to qualify and participate during the right probability windows.
Revenue from assets already capable of participation.
Load Planning
Load is difficult to plan during weather events and grid dynamics.
System-level and regional demand curves combining weather, historical patterns, and live signals.
Adjust operational schedules, procurement plans, and demand response readiness.
Fewer demand-related cost surprises and more reliable operational planning.
Procurement
Procurement timing is reactive rather than forward-looking.
Price forecasts at node, zone, and hub level with forward visibility.
Time procurement and shift flexible load around forecast price windows.
Reduced exposure to price spikes and adverse market outcomes.
Isolation
Forecasting and operations run on separate information.
Integrated price, demand, and grid condition intelligence connected to execution.
Align load management, curtailment, and asset operations to one intelligence source.
Faster decisions, lower operational overhead, and one system coordinating it all.
Built for Organizations That Carry the Load


Manufacturers, data centers, campuses, and large commercial operations face energy as one of their largest controllable costs. AI Forecasting delivers clear signals on when to curtail, when to consume, and when demand response pays off, without requiring an internal energy team.


Operations with the ability to shift consumption need to know when shifting is worth it. Price, demand, and peak forecasts make that decision systematic rather than reactive.


Set procurement strategy and manage load risk across ISOs using intelligence that moves with the market. Forecasts at node, zone, and hub level with forward visibility built for hedging decisions.


Manage load risk, inform hedging positions, and sharpen procurement timing against volatile wholesale markets. Proprietary data depth that retail providers cannot replicate in-house.


Forecast price, demand, peak, and ancillary conditions across the full generation-to-distribution value chain in one layer. All North American ISOs covered.


Optimize trading with precise, comprehensive ISO and ancillary market intelligence. Access the historical depth and real-time signal accuracy required for backtesting strategies and bidding decisions.
What Separates It From Everything Else
Proprietary Data at the Foundation
Most forecasting tools train on public ISO feeds only. Arcobi's models train on data the company originates from ISOs, weather, Congestion, 25+ years, hundreds of billions of rows, and 350,000+ streams and much more. That data depth does not exist elsewhere.
Lead Time That Actually Changes Decisions
Coincident peak probability scores escalate over multiple days as the window approaches. Price and demand forecasts reach your team with enough runway to act.
Human Judgment on Edge Cases
Our propreitary AI/ML generates the forecasts. Domain experts validate outputs during extreme weather, regulatory events, and unplanned outages. The speed of automation combined with the judgment of experienced market operators produces a more reliable result than either alone.
One Intelligence Layer Across the Platform
AI Forecasting is one product in a unified stack. It works standalone. It also integrates natively with the rest of the Arcobi platform — so price, demand, and peak intelligence flows directly into asset strategy and operational decisions without rebuilding your workflows.
What Better Forecasting Delivers
Across the Arcobi customer base, over $1B in energy cost savings opportunities have been identified to date.
Avoided transmission charges. Tighter procurement timing. Demand response revenue captured. Analyst time redirected from data preparation to decisions that move the business.
$1B+
28%
$350K
Frequently asked questions
How does this compare to building in-house?
Building equivalent capability requires sourcing 25+ years of market data, developing deep learning models, securing proprietary data partnerships, and staffing data scientists with energy market expertise. Arcobi delivers this as a managed service with continuous model improvement.
Can we use AI Forecasting standalone?
Yes. AI Forecasting works as a standalone product. It integrates natively with the rest of the Arcobi platform when you're ready to expand, but there's no requirement to adopt anything else upfront.
How are forecasts delivered?
Dashboards, REST API, email and SMS alerts, and scheduled reports. Your team accesses forecasts through whatever channel fits your current workflow.
What does onboarding look like?
Arcobi configures forecasting models for your markets, loads, and operational objectives. The process is built for rapid deployment with minimal integration overhead. Your team can be operational without a multi-month implementation project.
What data goes into the forecast models?
Three inputs that competitors can't replicate together: 25+ years of proprietary North American market data originated directly by Arcobi; weather instrumentation through Climavision; and direct market participant behavior signals beyond standard ISO feeds. Models also incorporate real-time prices, grid metrics, outages, and generation data as they update.
What makes these forecasts more accurate than alternatives?
Three factors: 25+ years of proprietary training data exclusive to Arcobi; proprietary weather instrumentation through Climavision; and direct market participant behavior signals that go beyond standard ISO feeds. Human-on-the-loop validation during edge cases adds a further layer of reliability.
Which markets does AI Forecasting cover?
Major North American ISOs and power markets. DataHub covers 330,000+ streams across ERCOT, AESO, CAISO, PJM, MISO, NYISO, SPP, ISO-NE, IESO, CENACE, plus FERC, NERC, and WECC regions. Contact us for specific market coverage details.
Know What's Coming Before It Costs You
If you already have forecasts and DR enrollment, you're sitting on value that depends on execution timing. Signal Orchestrator gives you a coherent, program-aware instruction set and executes it through your existing controls.