Know When Supply Is Tightening Before It Shows Up in Your Bill
Track generation availability across your region to anticipate price spikes and supply constraints before they arrive. Get the lead time to adjust operations, curtail load, or lock in favorable rates on your terms.

Supply Constraints Do Not Announce Themselves
Unplanned generation outages, low wind or solar output, and tight reserve margins all compress available supply. When that happens in a peak demand window, prices move sharply. Transmission charges follow if coincident peaks land during those hours. For organizations running large loads or managing dispatchable assets, the window between a supply signal and a price event is often measured in hours. An organization that sees the tightening first can curtail load before the peak forms, lock in favorable procurement rates before the market reprices, or pre-position for demand response participation while enrollment windows are still open.
An organization that sees it after the fact absorbs the full cost.
The Signals That Influences Prices
The integration of generation and grid intelligence allows for the anticipation of price events before they are reflected in the market.


Real-time and forecasted data showing how much thermal, renewable, and dispatchable capacity is online, planned, or at risk. Outages and deratings appear before they affect price.


When operating reserves approach minimum thresholds, grid operators act. Reserve margin compression gives you time to adjust load or activate assets before emergency conditions trigger involuntary action.


Wind and solar output shifts with weather. Tracking expected renewable generation against demand shows when dispatchable capacity will be called and when the market will tighten.


ISO and utility demand response programs activate based on grid stress. Tracking the conditions that precede those events lets you pre-qualify, confirm availability, and execute when called.


Planned and forced outages reduce available capacity in ways that can be anticipated. Visibility into the outage landscape across your region sharpens both procurement and operational planning.
From Grid Visibility to Operational Decision
These layers that take you from raw data to a decision you can act on.
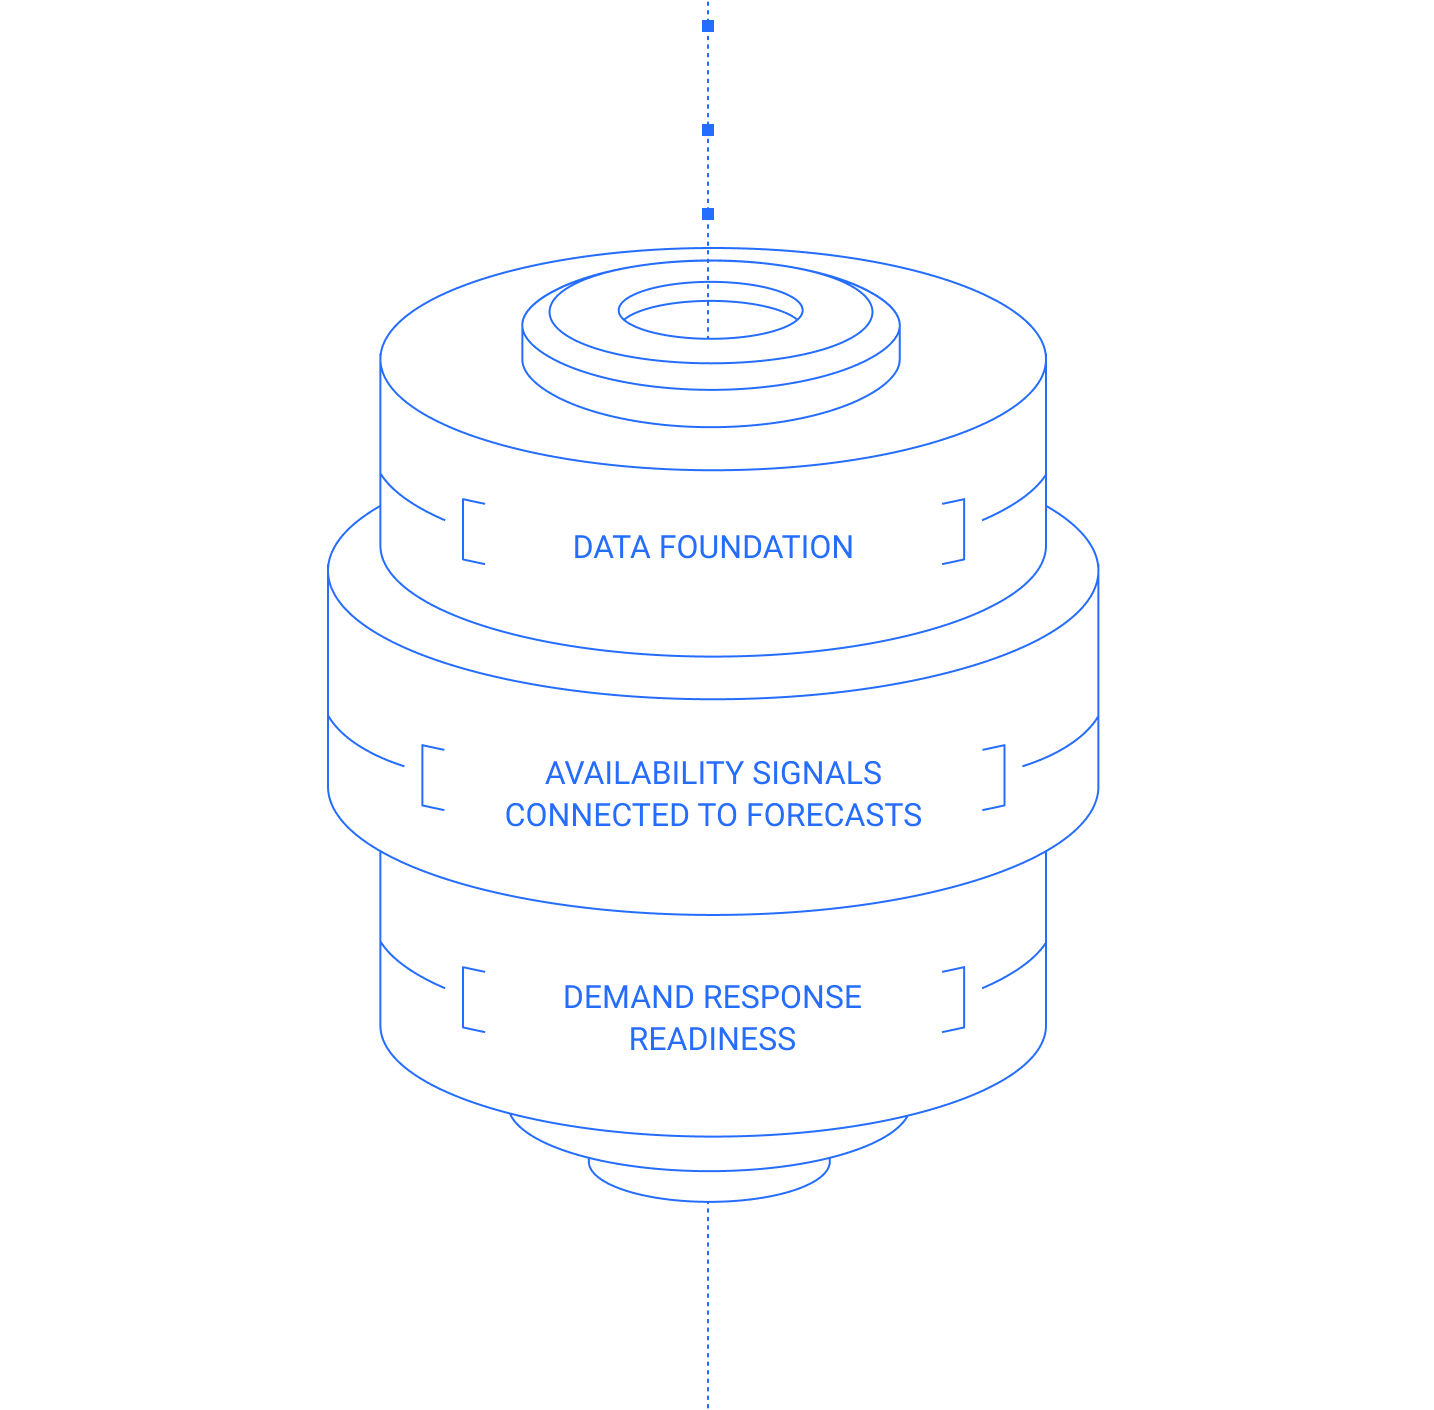
Data Foundation
DataHub holds 25+ years of curated North American power market data covering real-time generation output, outage reporting, reserve margin data, ISO dispatch signals, and 350,000+ streams across markets. Arcobi originates this data directly coverage and depth that aggregated public feeds cannot match.
Availability Signals Connected to Forecasts
Generation availability data does not operate in isolation. Arcobi combines availability and outage signals with AI price and demand forecasts, producing a layered picture of where the market is headed and why. When renewable output fall and thermal reserves are thin, that correlation surfaces as price signal with operational implications attached.
Demand Response Readiness
For organizations enrolled in demand response programs, availability intelligence closes the loop between grid conditions and participation readiness. You see when activation is likely before the notification arrives. Assets are confirmed available. Curtailment plans are ready to execute.
What You Do With This Intelligence


Large Thermal Unit

A large thermal unit goes offline ahead of a peak demand day.

Real-Time Outage reporting and remaining available capacity across the ISO.
Curtail load or lock in procurement before the market reprices.

Avoided Exposure to the Price Spike After the Outage.
Reserve Margins
Reserve margins are approaching minimum thresholds during a heat event.
Reserve margin data combined with demand and temperature forecasts.
Activate assets in Demand Response or shift operations before grid operators intervene.
Participation on your terms rather than emergency compliance.
Renewable Output
Renewable output is forecasted to fall significantly during a peak window.
Wind and Solar generation against expected load, correlated with price forecasts.
Pre-position dispatchable capacity or reduce flexible load ahead of the window.
Captured arbitrage value and avoided procurement at peak prices.
Demand Response Event
A Demand Response event is likely within the next 24 to 48 hours.
Grid stress signals and the conditions that Precede ISO Demand Response activation.
Confirm asset availability and curtailment readiness before the formal notification.
Full participation with no scramble at activation.
Transmission Charges
Transmission charges are at risk during a tight operating window.
Available capacity and demand signals that identify likely Ccoincident Peak windows.
Curtail load during the hours most likely to set your transmission rate.
Reduced transmission charges for the full rate period.
DynamicDR
Demand Response Optimization
Arcobi and Enel North America have partnered to deliver DynamicDR — a demand response optimization tool that combines Arcobi's real-time market intelligence with Enel's North American demand response network.
The intelligence layer is Arcobi's. The DR network and program management is Enel's. Together, the result is a demand response program that performs better because both sides of it are built on accurate, timely information.
If your organization is already executing a demand response strategy but finds it time-intensive or reactive, DynamicDR delivers the intelligence and structure to make it systematic.
[ 01 ]
Real-time market intelligence, coincident peak forecasting, energy cost visibility, and activation window signals.

[ 02 ]
Enel North America is the world's #1 demand response provider, offering 4.8+ GW of DR capacity in North America, helping organizations earn payments by reducing energy during peak grid demand.
Built for Organizations That Cannot Afford Surprises


Large energy consumers with flexible operations need advance notice of supply tightening to make curtailment, procurement, and scheduling decisions before costs are locked in. Availability intelligence delivers that notice with enough lead time to act.


Aggregators and program administrators managing portfolios of enrolled customers need accurate grid condition intelligence to call activations with confidence, minimize non-performance, and demonstrate program value.


Organizations enrolled in ISO or utility demand response programs benefit from seeing activation conditions in advance. Pre-positioning assets and confirming readiness improves participation performance and avoids penalties for non-performance.


Operations with the ability to shift consumption get full value from that flexibility only when they know when to use it. Supply tightening signals identify those moments clearly.

Procurement decisions made with visibility into near-term generation availability are better timed and better hedged than those made on price history alone.

Operators managing dispatchable generation need to know when the grid will need them. Availability intelligence across the ISO sharpens dispatch timing and maximizes revenue from dispatchable capacity.
What Makes This Different
Four things that distinguish Arcobi’s availability intelligence from what ISOs publish and aggregated feeds provide.
Data at Scale, Directly Originated
Arcobi holds 25+ years of curated North American power market data, including real-time generation output, outage reporting, and reserve margin data across all major ISOs. Faster updates, deeper coverage, and fewer gaps during high-stress market events when data quality matters most.

Availability Intelligence Connected to Price Forecasts
Tracking available capacity matters most when it connects to what prices will do because of it. Arcobi combines generation availability signals with AI price and demand forecasts, so you see not just what is happening on the supply side, but where prices are likely to go as a result.

Earlier Than ISO Notifications
ISO notifications are issued after activation conditions are confirmed. Arcobi tracks the underlying conditions that lead to those activations, giving you visibility before the formal notification arrives. The difference is almost always measured in hours.

25 Years of Market Context
Understanding whether a current reserve margin or outage situation is unusual requires historical context. Arcobi’s depth of market data means availability signals are interpreted against decades of comparable conditions, not just the last 30 days.
What Earlier Visibility Delivers
The difference between these outcomes and their alternatives is almost always about lead time. Avoided transmission charges. Demand response participation without last-minute scrambles. Procurement timed to supply conditions rather than price history.
$1B+
28%
$350K
Frequently asked questions
What does onboarding look like?
Arcobi configures data feeds and dashboards for your relevant markets, assets, and operational objectives. Built for rapid deployment with minimal integration overhead.
How does this differ from ISO notifications?
ISO notifications are issued after activation conditions are confirmed. Arcobi tracks the underlying conditions that lead to those activations — reserve margins, outages, renewable variability, and grid stress signals — giving you visibility before the formal notification arrives.
Does this work standalone or require other Arcobi products?
Asset Availability and Demand Response intelligence is available standalone. It integrates natively with AI Forecasting for price correlation when you are ready to expand. No requirement to adopt anything else upfront.
How does this connect to demand response programs?
Arcobi tracks the grid stress conditions that precede ISO and utility demand response activations. This gives enrolled organizations advance visibility into likely activation events, improving readiness and participation performance before formal notification arrives.
Which ISOs and markets are covered?
Major North American ISOs and power markets. DataHub covers 330,000+ streams across ERCOT, AESO, CAISO, PJM, MISO, NYISO, SPP, ISO-NE, IESO, CENACE, plus FERC, NERC, and WECC regions. Contact us for specific market coverage details.
See Supply Constraints Before They Become Price Events
Arcobi turns uncertainty into opportunity for everyone who touches a wire. Asset Availability and Demand Response Intelligence is the visibility layer that makes it possible.