
.png)

ERCOT is now tracking about 438 GW of large-load interconnection requests. ERCOT’s previous peak demand record was 85.5 GW, set in August 2023. During the July 2026 heat wave, the grid’s hourly demand reached 91,134 MW on July 22 which was a new record at the time, subject to ERCOT’s final-settlement process.
So the queue is about five times the largest load Texas has ever served.

Grid officials are quick to say that number overstates what will actually connect. In many cases, ERCOT cautions that the main number is not a forecast of connected load: in its May update, it said the vast majority of large-load requests had not submitted interconnection studies. The queue is an early signal of interest and not a committed load forecast.
Fair enough.
But every one of those requests turns into questions for someone on a trading desk. What's the load going to be? What happens to the evening ramp when this load comes online? Which load zones carry the price risk?
The questions keep multiplying. The way most teams answer them hasn't changed in years.
I want to walk you through why that's starting to change, how the Model Context Protocol can support, and what happened when I asked Claude a real question about ERCOT data this week.
Pulling power market data can be cumbersome
You probably know the morning routine. Log into a portal. Export a CSV. Export another one for outages. Line up the timestamps, fix the daylight-saving gap, build the pivot table, paste the chart into an email.
Infact, the volume makes it worse than it sounds. ERCOT clears RT LMP every five minutes, which is 288 intervals a day per load zone. Across eight load zones, you're looking at 2,304 RT LMP values every day before analyzing day-ahead prices or outage capacity. Over a 120-day window that's more than 276,000 rows of price data alone.
Anaconda's 2022 survey found that data professionals spend about 37.75% of their time on data preparation and cleansing. Two years earlier, the same survey estimated it at 45%.
What MCP actually is
Simply put, the Model Context Protocol is an open standard for connecting AI applications to outside tools and data.
The architecture has three layers: hosts (user-facing AI applications), clients (protocol-aware connectors within those hosts), and servers (tool and data providers). Messages are processed over JSON-RPC.
In practice, a data provider publishes a set of tools with plain-language descriptions. Claude reads those descriptions, decides which tool fits your question, and calls it with the right parameters. You never write the query yourself. No more get(), fetch(), fetchall() etc.
Essentially, adoption of this technology was incredible. The MCP ecosystem has grown rapidly since OpenAI's adoption in March 2025.
On December 9, 2025, Anthropic donated MCP to the newly formed Agentic AI Foundation (AAIF) under the Linux Foundation, co-founded by Anthropic, Block, and OpenAI. By late March 2026 the protocol had crossed 97 million monthly SDK downloads, with 10,000+ public MCP servers.
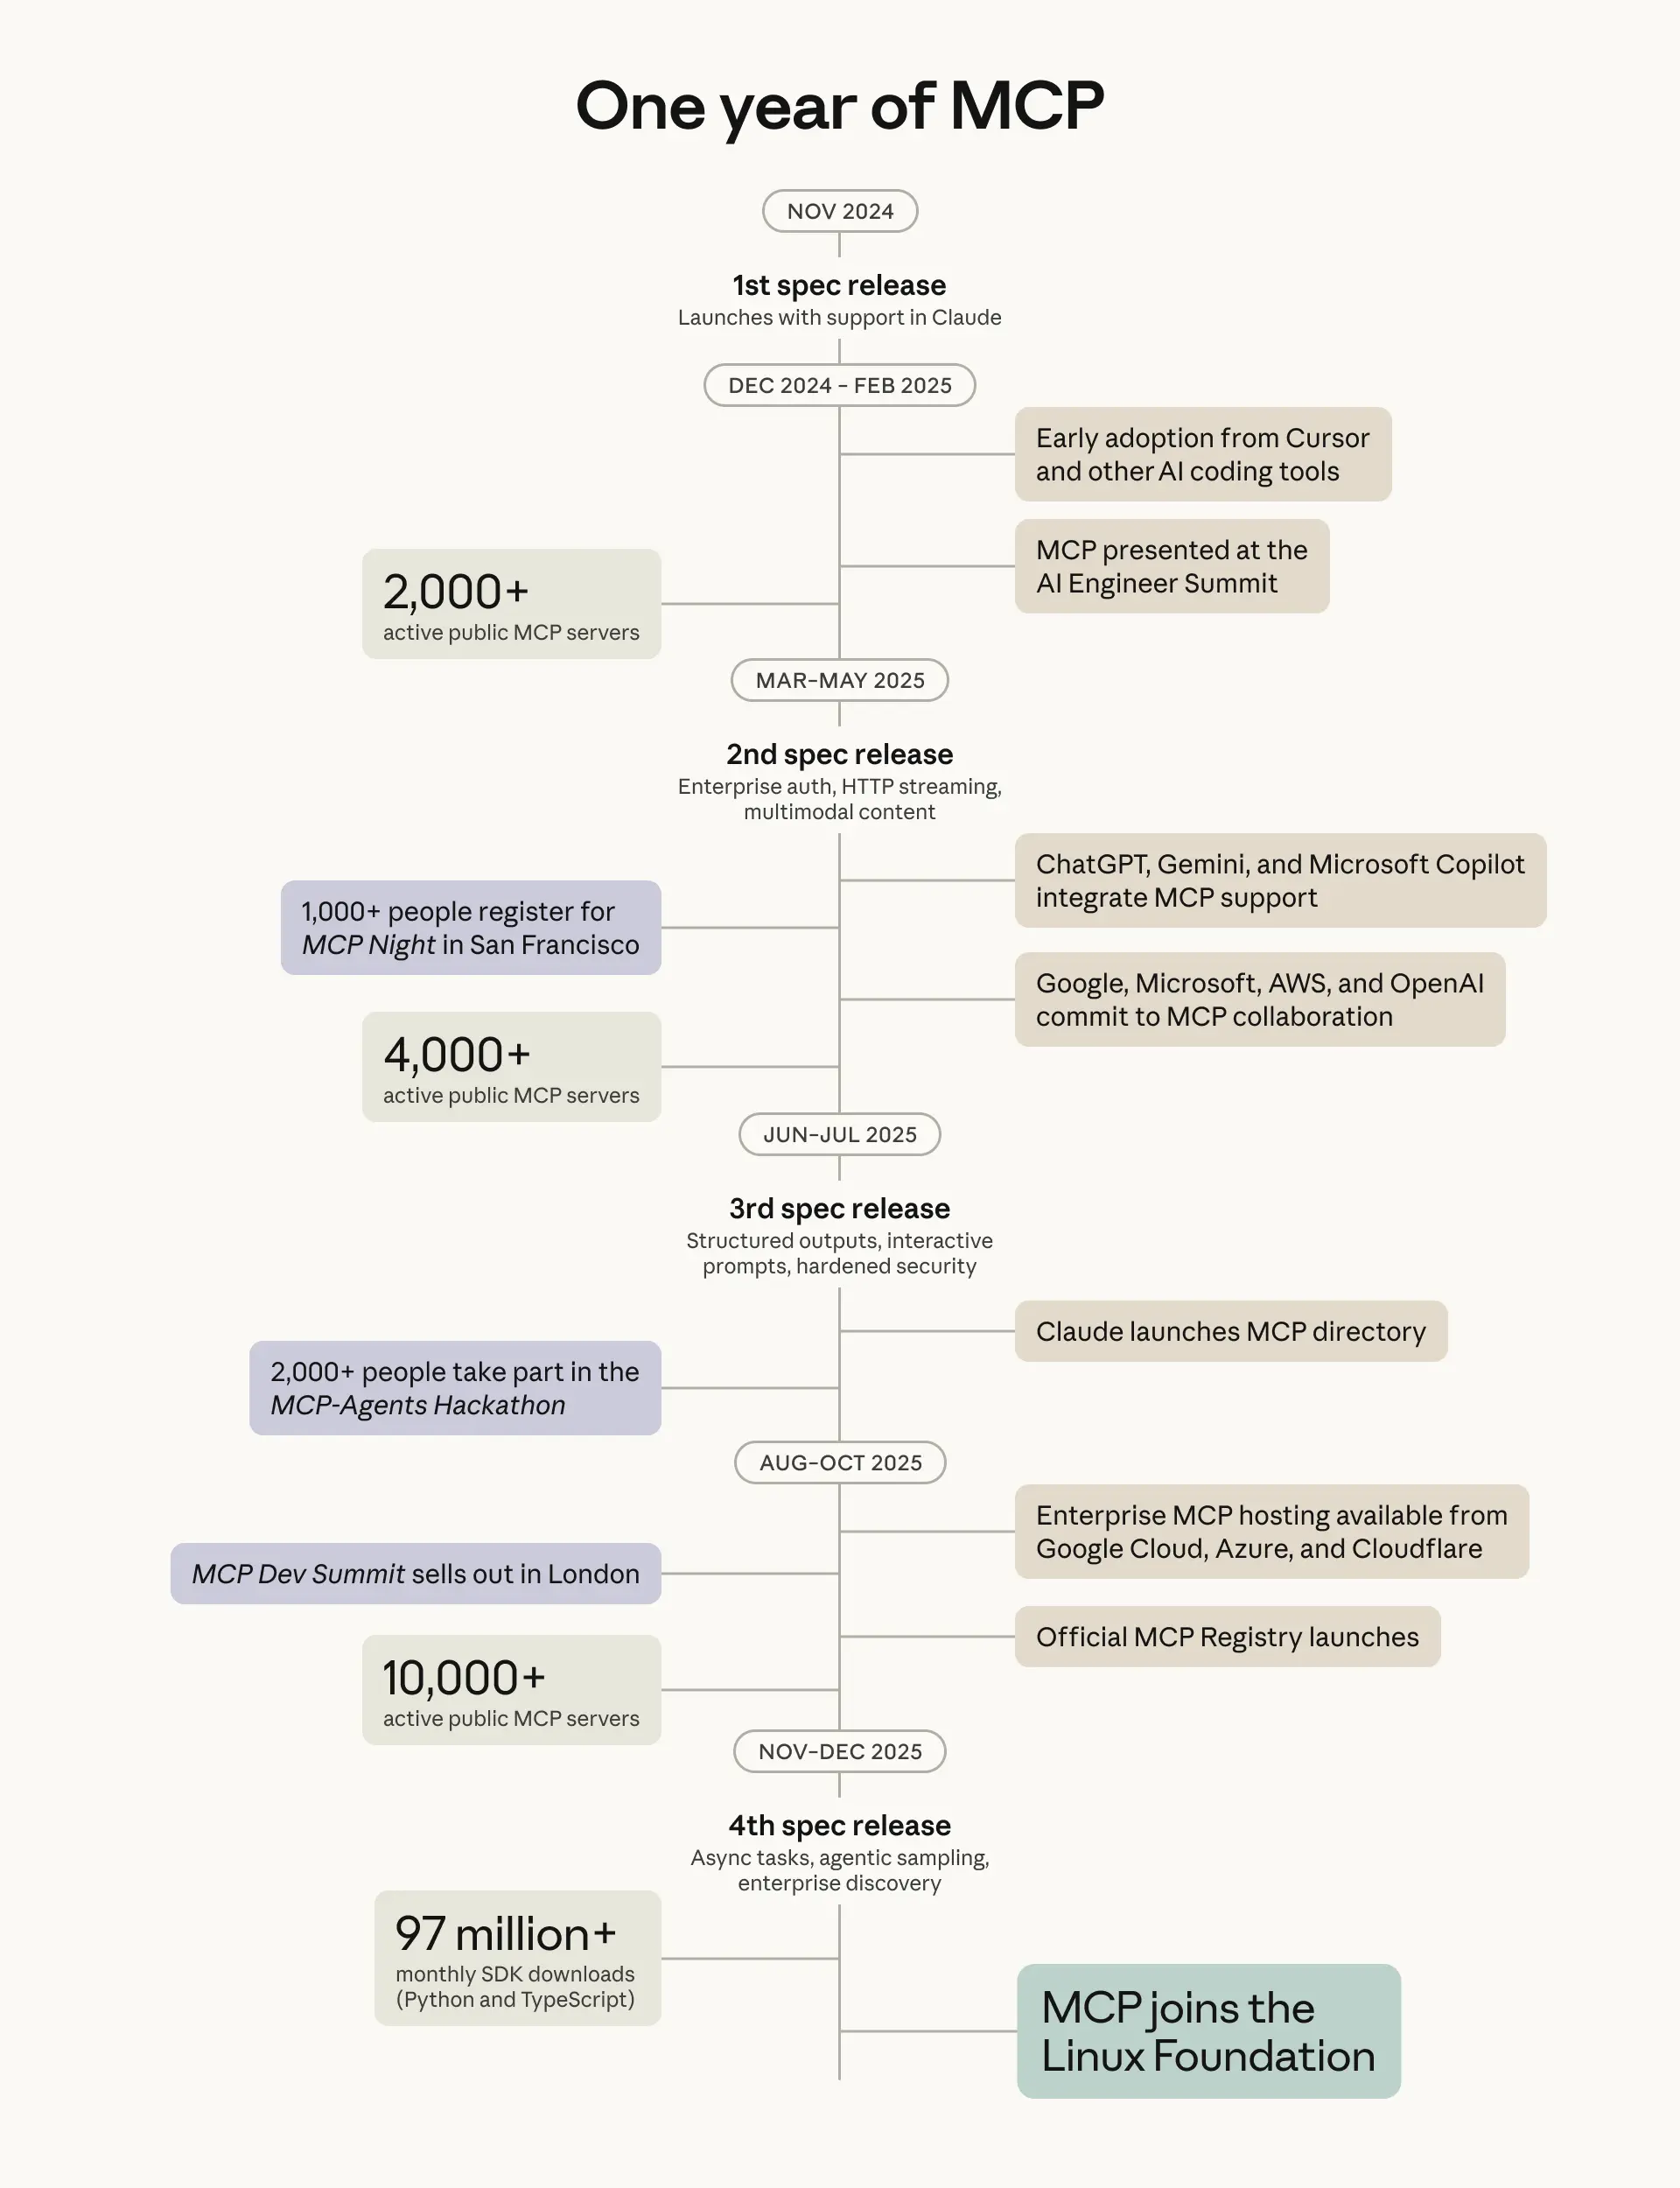
What really caught my attention is that adoption has been deepest in developer and tech-enablement tooling, and penetration into regulated industries remains limited.
Power markets sit right in that gap. Trading and analytics desks still run on ISO portals, vendor terminals and a lot of Excel. The AI assistant on your laptop can write a Python script, but it can't see the market.
Essentially, we built Arcobi-MCP to integrate AI with power market data, improving the efficiency of power market analysis and reducing the friction between data and customer's preferred insights.
From chatbot to agent architecture
A chatbot answers from what it learned in training. Ask it about yesterday's Houston LMP and it will either refuse or make something up. Check out the AI model training data cutoff timeline below:
.png)
An agent works differently. It plans a sequence of steps, calls tools, reads the results and decides what to do next. The quality of the answer depends almost entirely on how well the tools are designed and what instructions and context it was provided.
When Claude connects to Arcobi-MCP, the first call is usually describe_data. It returns what exists on the server: the date window, every price and outage series, each series' native granularity, row counts and when the data was last refreshed.
So, if you ask about a date outside the window, the tool instructs the model to say so plainly. It won't hallucinate and fill it from general knowledge, and it won't quietly swap in a nearby date. Principally, it follows guidelines and instructions stated in our backend architecture with strong guardrails to ensure the data and analysis you receive it upto data and accurate.
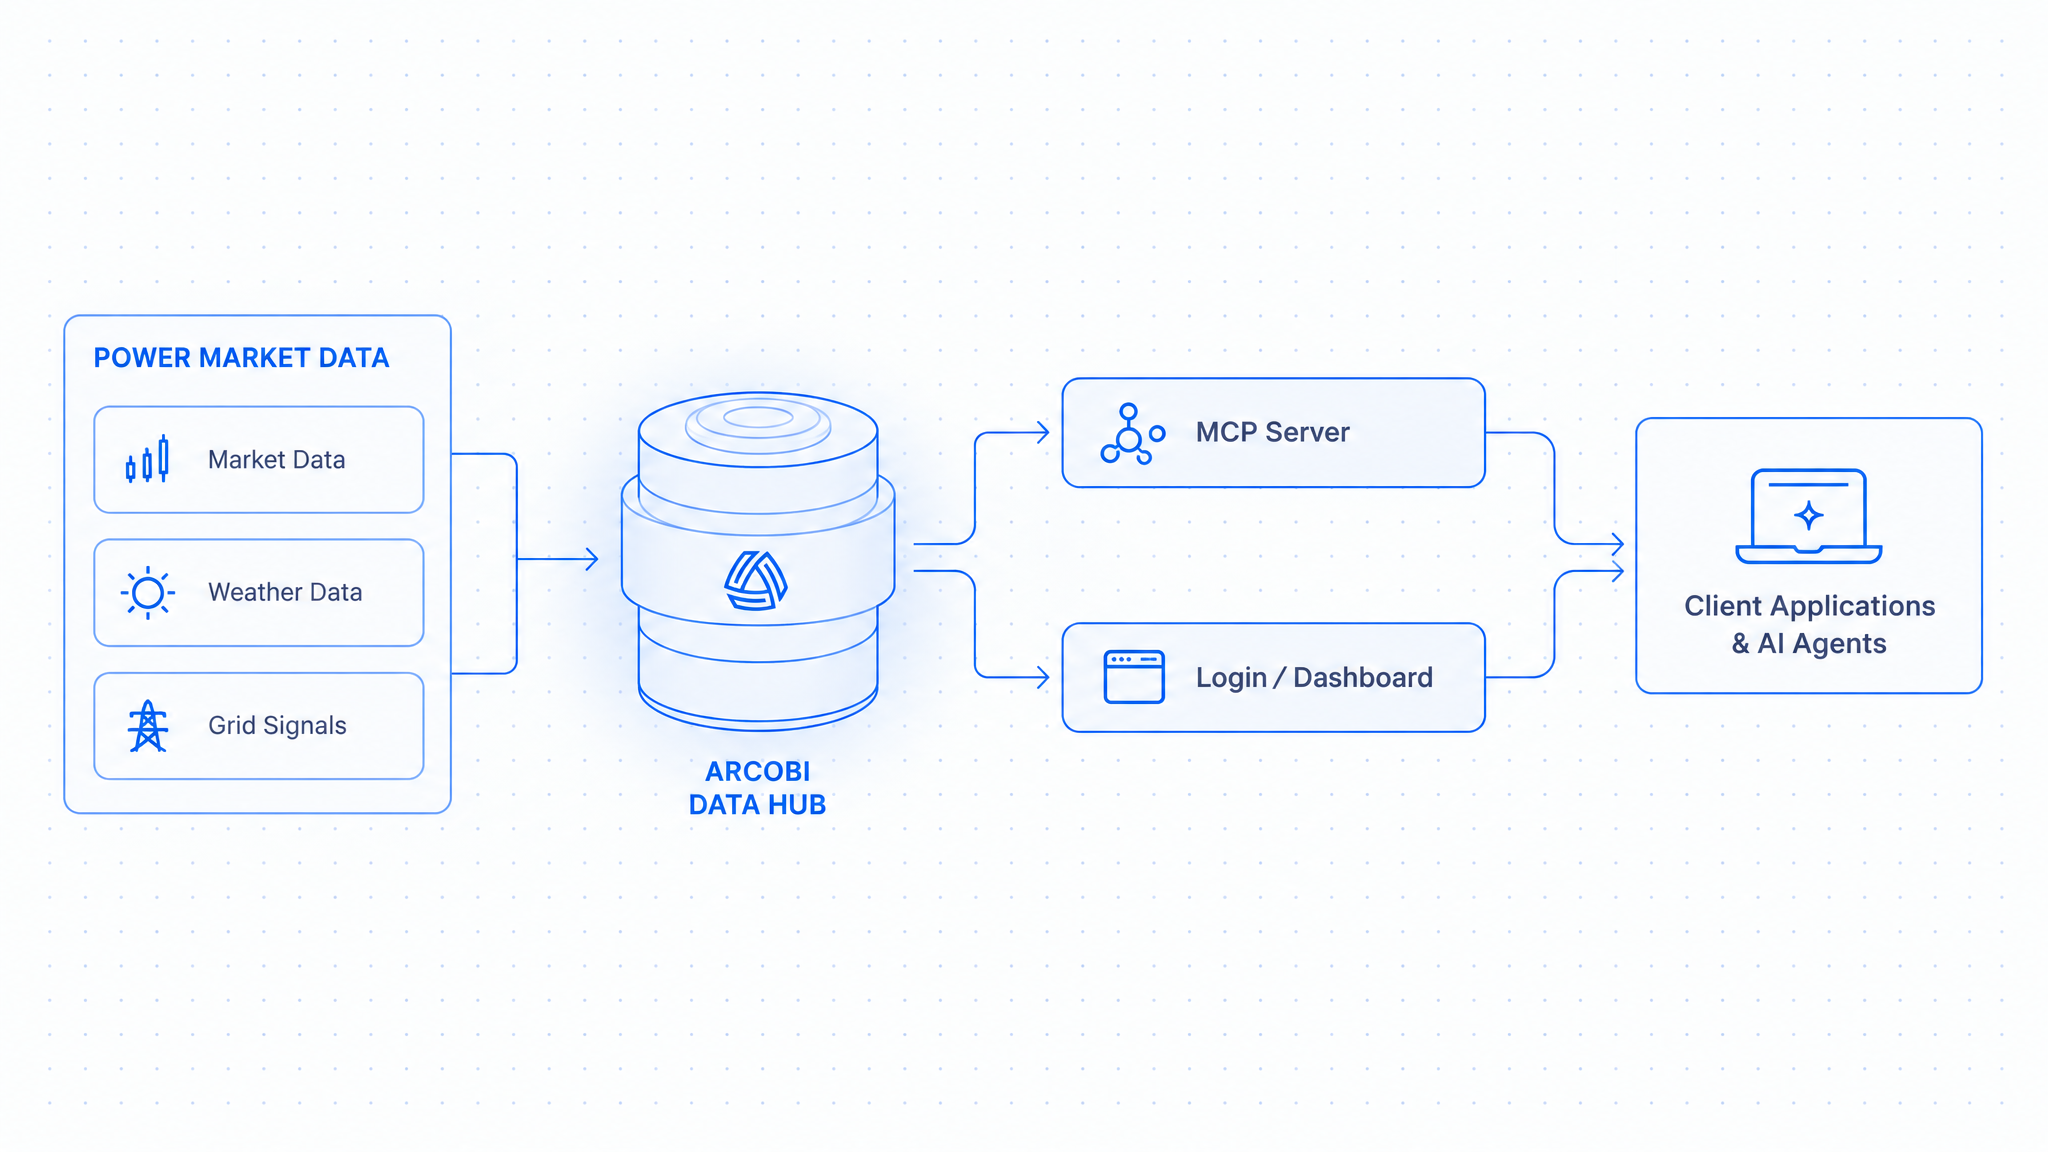
From there, the agent picks the right tool.
Here's an example:
get_prices pulls day-ahead hourly or five-minute RT LMP, get_outages returns outage capacity, planned and unplanned. get_joined_data lines up price and outage series on one timeline. summarize_relationship computes the correlation and compares prices in high-outage and low-outage periods.
A couple of design details are worth calling out for the technical reader. Price and outage data use different zone systems, so they're separate parameters, and the agent handles the mismatch. The server refuses to interpolate. Ask for one-minute data from a five-minute series and you get an error. If a response is too large, the metadata flags it as truncated and the agent re-requests at a coarser granularity.
Those choices sound boring but they're what keeps an LLM honest with market data.
What one question turned up
Before writing this, I asked Claude a question (using the Arcobi MCP of course)- Do Houston RT LMP spikes line up with ERCOT resource outages?
It pulled 2,856 hours of joined data, from June 6 through October 3, and ran the numbers.
The answer surprised me a little.
Houston RT LMP averaged $35.11/MWh over the window. The correlation between hourly price and total resource outage capacity came in at 0.13. Weak. Hours with above-median outages (more than about 9,560 MW) averaged $37.84/MWh, compared with $32.39 in the lower-outage hours. A modest gap.
With regard to spikes, only 38 hours cleared $100/MWh, which is 1.3% of the window. Thirty-two of those 38 fell in the hours stamped 7 p.m. through 10 p.m. The single highest hour, August 26 at 10 p.m., averaged $525/MWh with resource outages around 8,700 MW, which was below the window's median.
Average price by hour of day makes the shape obvious. Around 8 a.m., Houston RT LMP averaged $22.40. By 8 p.m., it averaged $59.80.
So what's going on? This data alone can't settle it. The timing points toward the evening ramp, when solar output drops off and demand stays high. That's a hypothesis, and the server already carries a net-load composite series (load - wind +solar + outage capacity). Basically, the next prompt writes itself.
No CSV downloads. No VLOOKUPs. Just a simple question, a few tool calls and a follow-up question that was better than the first.
Streamlining trading with AI prompts: Start with a morning market summary, analyze day-ahead and real-time price spreads, and conclude with monthly trend insights.
We built our trailer around three moments in a real trading day.
The first is the morning brief. Claude can run scheduled tasks, so a prompt like "summarize overnight RT LMP by load zone and flag any changes in unplanned outages" can run before you sit down. You start the day reading, not exporting.
The second comes before day-ahead close. You ask for the DA/RT LMP spread by load zone and hour over the past two weeks. Claude pulls both series, aligns them and shows where the spread has been widest. You decide whether to bid or hedge. The tool's job is to get the evidence in front of you before 10 a.m.
The third is the evening analysis. An investor or a manager wants context on why prices moved this month. Claude pulls the month's numbers, compares them with prior months and drafts the explanation. You edit it and send it.
None of these require a data engineer in the loop. Each one still needs your judgment at the end.
Refresh Limits and Updates
I'd be doing you a disservice if I skipped the limits.
For now, the data on Arcobi-MCP refreshes twice daily, at 6 a.m. and 9 p.m. Central, over a 120-day rolling window. It's built for analysis and preparation. It's not a dispatch signal, and you shouldn't treat it like one.
Despite the strong guardrails, LLMs can still misread a result or overstate a pattern. The grounding steps we've taken reduce that risk significantly. Ask Claude to show the tool calls and parameters it used. Check a number against your own records the first few times. Treat a correlation as a direction and not a typical conclusion.
Security deserves attention too. We have latest OAuth from our end point. Even MCP's own advocates note that enterprise-grade authentication and security are priorities on the 2026 roadmap but still evolving. If you're handling sensitive positions, set up access controls before you connect anything. Ofcourse for something extremely granular you can always use our API and other data deliver methods.
Sign up to here for a quick demo: https://www.arcobi.com/contact
Why headless data and systems matter in this day and age
Dashboards assume you know your question in advance. Someone decided which charts to build six months ago, and you live inside those choices.
Headless data works the other way. The data sits behind a standard protocol, and you choose the interface. Today that's Claude and ChatGPT. Tomorrow it could be an internal agent your team builds on the same protocol, without a new data contract.
ERCOT is the first market on our server. Our architecture design is meant to be scalable, all our data will be available via MCP in the coming weeks - PJM, CAISO, AESO or any other ISO where the questions outrun the spreadsheets.
So I'll leave you with the question I keep asking our own team.
How much of your week goes to pulling data, and how much goes to thinking about what it means?
If you'd like that ratio flipped, join the Arcobi-MCP waitlist at connect.arcobi.com. Claude & ChatGPT access opens first.
Stop pulling the data. Start asking it.
Some Related Cases




Let's explore your energy challenge together.
Every energy challenge is different. Tell us yours, and
we'll show you what 25 years of market intelligence can do.