

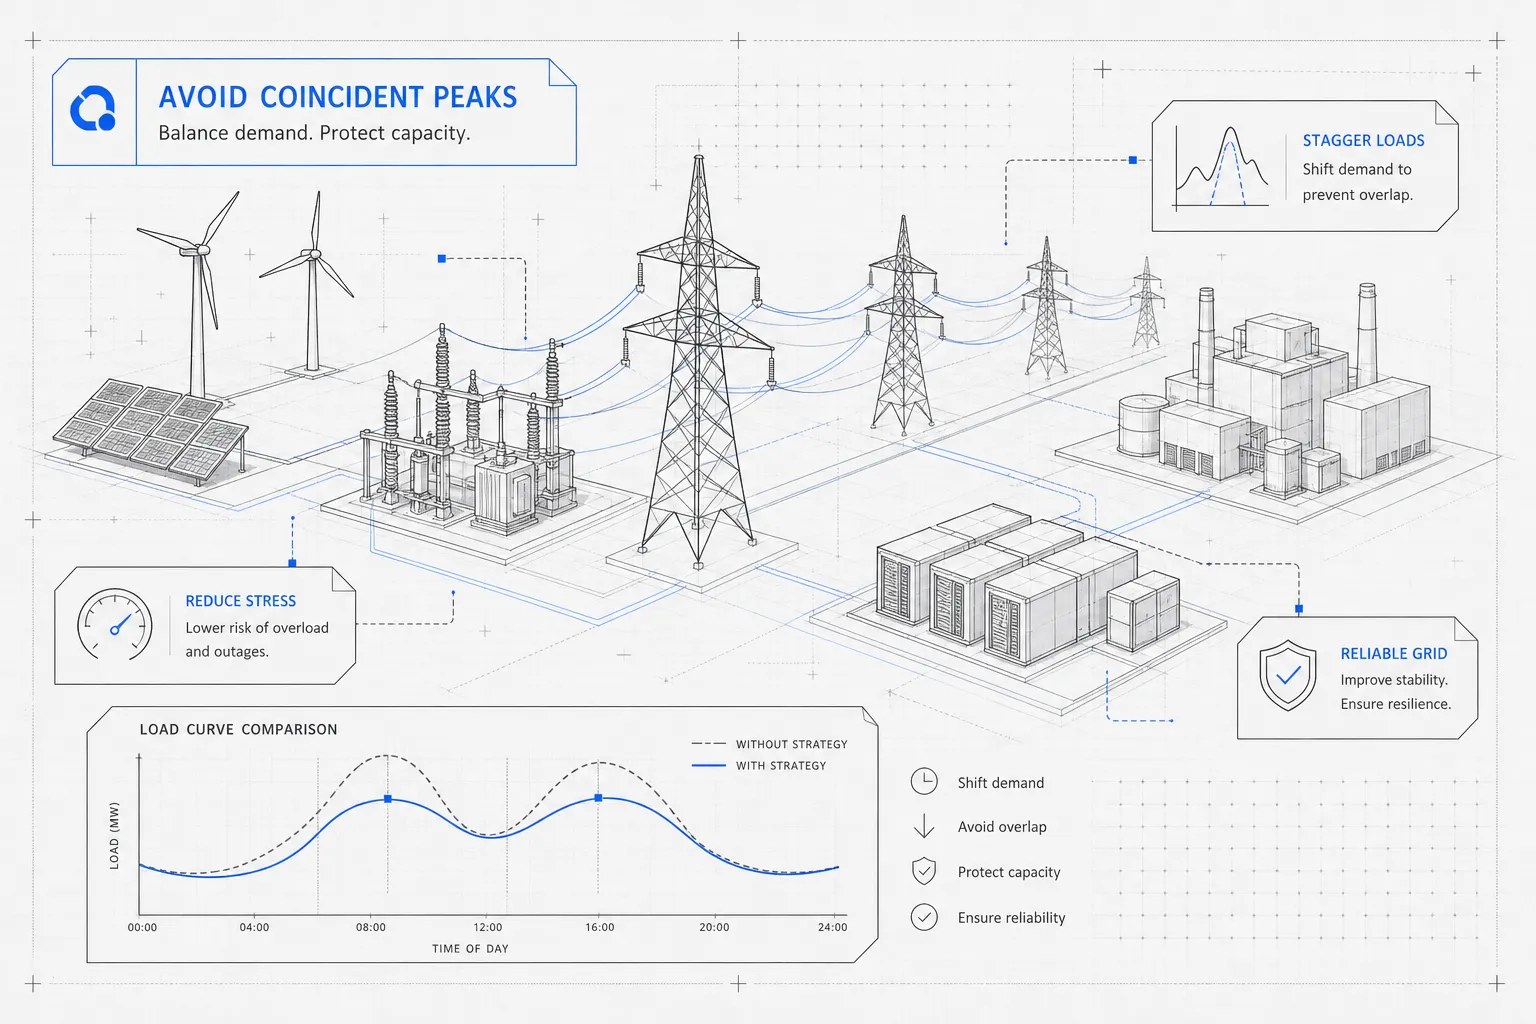
A large manufacturer in Texas ran a full production shift on a hot Wednesday afternoon in August. Nothing unusual. But that afternoon happened to be one of ERCOT's four coincident peak intervals for the year. The facility recorded its highest measured demand during that window, and by December, ERCOT had filed the numbers.
The result was a six-figure transmission charge locked in for the next twelve months, based entirely on what that facility was drawing from the grid during four 15-minute windows. Many facilities never specifically track those intervals, and that oversight is exactly why coincident peak avoidance deserves a dedicated operational strategy.
That's how coincident peak charges work. Your bill isn't set by your own peak demand. It's set by your demand during the hours when the broader grid hits its seasonal maximum. Those specific intervals, often just a handful of hours per year, determine what you pay in transmission and capacity charges for the following year. Miss them, and you pay full freight. Manage them well, and you can cut your annual electricity costs by six figures or more.
Commercial and industrial (C&I) energy managers who build a repeatable system around CP forecasting, load flexibility, and automation tend to capture significantly better outcomes than those reacting manually in real time, case studies from ERCOT and PJM facilities consistently show double-digit percentage reductions in CP exposure when structured programs replace reactive monitoring.
Platforms like Arcobi have made that entire workflow fully automated, turning what used to be a seasonal fire drill into a continuous background process. This article walks you through exactly how ISOs calculate coincident peaks, what the charges actually cost, which operational strategies deliver real savings, and how to build a system that catches every event.
How major ISOs define and measure a coincident peak
Understanding the mechanics of your specific ISO program is the starting point. The rules differ significantly between markets, and the wrong assumption about how many peaks matter, or how long each interval lasts, can undermine an otherwise solid coincident peak avoidance strategy.
ERCOT 4CP: one peak per summer month, four months total
ERCOT selects the single highest 15-minute settlement interval in each of the four summer months: June, July, August, and September. That produces four coincident peak intervals per year, each based on aggregate system demand across the entire ERCOT grid. A customer's demand during those four specific intervals is averaged, and that average sets their transmission cost allocation (called NITS charges) for the following year. ERCOT files each distribution service provider's average 4CP demand by December 1, and that number governs transmission billing for the next twelve months. Every megawatt you were drawing during any of those four windows has a direct, measurable dollar consequence.
PJM 5CP and the single-peak markets
PJM operates differently, tracking the five highest system peak hours across the June-through-September window, each falling on a separate weekday. A customer's load during those five hours determines their Peak Load Contribution (PLC), which is then used to set capacity charges. The 2026/27 delivery year capacity price cleared at $329.17 per MW-day, translating to roughly $9.87 per kW-month. PJM charges also vary by zone through zonal transmission rates layered on top of the capacity component, which is why facilities in high-cost PJM zones face meaningfully different total exposure than those in lower-cost zones.
MISO, NYISO, and ISO-NE each use a single annual coincident peak interval: one hour where the system hits its maximum, and every customer's demand at that exact moment sets their cost allocation for the period. For C&I customers in those markets, the math is stark. There's only one event that matters each year. Missing it by a single hour costs you the full charge. Managing it precisely costs you nothing beyond the operational adjustment.
Why a single peak hour can reset your electricity costs for an entire year
The financial stakes here are calculable, and for large facilities they're significant enough to justify serious operational investment in avoiding them.
The math behind demand charge exposure
In ERCOT's transmission pricing structure, demand charges can run $65, $80 per kW annually, based on figures from ERCOT's published transmission cost-of-service filings. A 5 MW facility that runs fully coincident across all four CP intervals can face roughly $400,000 per year in transmission charges from those events alone (5,000 kW × $80/kW = $400,000 at the high end of the range).
In PJM, coincident peak charges typically run $100, $150 per kW depending on zone. A mid-sized industrial facility at 580 kW of CP demand, for example, can face roughly $60,900 or more in annual charges from just five hours of the year at applicable zonal rates. These numbers don't include base energy cost. They represent transmission and capacity allocation on top of energy supply.
Real-world dollar impact that makes the business case
Coincident peak exposure routinely accounts for 10, 40% of a large C&I customer's total electricity costs, and for facilities with heavy, predictable loads the share can run higher. Documented examples from cold storage and manufacturing show facilities saving $500,000 or more at a single site in a single season when CP management is executed well. Americold's senior management reported saving an estimated $500,000, $600,000 at a single facility in a single month by controlling demand during coincident peak events.
For mid-sized data centers, the math is equally compelling. A 2,500 kW facility facing $480,000, $660,000 in unmanaged annual demand charges can capture $96,000, $264,000 in savings by reducing peak demand by 20, 40% during CP windows. These outcomes aren't limited to a handful of outlier sites. Facilities with flexible load and a reliable system for acting on peak forecasts have demonstrated similar results across multiple seasons, though actual savings depend on tariff structure, load flexibility, and forecast accuracy.
Three operational levers for reducing CP exposure
Knowing a CP event is coming is only half the equation. The other half is having operational strategies ready to execute when the window opens.
Load shifting and curtailment timing
The most direct coincident peak avoidance strategy is reducing facility demand during the highest-risk windows, typically late afternoon on hot weekdays when grid stress peaks. Load shifting means moving non-critical processes such as charging cycles, batch manufacturing runs, and water heating to off-peak hours before or after the risk window. This approach avoids the operational disruption of hard curtailment while still moving the needle on measured demand during the CP interval.
Curtailment is harder to repeat consistently, but facilities with load factors below 60% and demand above 100 kW tend to see the strongest ROI from structured curtailment programs. Documented savings for mid-sized industrial sites in ERCOT run $15,000, $25,000 annually when curtailment is executed on the right hours. The key word is precision: curtailing on the wrong days wastes operational capacity without reducing CP exposure at all.
HVAC pre-cooling and building controls
Pre-cooling a commercial or industrial building one to two hours before the expected CP window lets HVAC systems coast during peak risk hours without sacrificing occupant comfort or process integrity. Research on commercial building pre-cooling strategies, including work published by ASHRAE and DOE building performance programs, reports peak power demand reductions of 3.4, 6.6%, with cost savings in the 10, 35% range depending on tariff structure and building design. This strategy is particularly effective in ERCOT's 4CP program, where summer afternoon windows are predictable enough to schedule building automation responses well in advance.
Staging and staggering large electrical loads, including compressors, air handlers, and pumps, during the alert window further flattens demand without requiring hard shutdowns. Integrated HVAC retrofit projects designed specifically for demand management have shown payback periods around 2.1 years in documented case studies, making pre-cooling one of the faster-payback capital investments available to building operators in CP-exposed markets.
On-site generation and battery coordination
Diesel generators and combined heat and power systems can offset facility demand during CP windows by supplying load locally rather than drawing from the grid, which reduces the kW contribution the ISO measures at the meter. Battery storage extends this capability by discharging during CP risk hours and recharging during low-risk periods. In markets that allow it, batteries may also be eligible for ancillary service revenues, though documented CP-specific ROI for battery systems varies significantly by market and facility configuration.
Timing is everything with both approaches. Deploying on-site assets based on a reliable CP forecast provides sufficient ramp time to position assets before the risk window opens. An alert that arrives at 2 PM for a 3 PM peak window often leaves insufficient time to bring a generator online or shift battery state of charge to the right level, a limitation that applies equally to HVAC repositioning and batch process adjustments. The forecast horizon matters as much as the forecast accuracy.
Coincident peak avoidance forecasting: day-ahead and week-ahead windows
A CP avoidance strategy is only as good as the forecast that triggers it. Operators who rely on the ISO's after-the-fact settlement data to learn which hours were coincident peaks are already too late. The forecast has to arrive early enough to allow a meaningful operational response.
Day-ahead and week-ahead prediction windows
The most actionable CP forecasting gives facility operators 24, 48 hours of notice at minimum. Leading platforms provide probabilistic risk scores up to seven days out, with updates two or more times per day as weather and grid load data refresh. A one-week horizon lets energy managers pre-position operational schedules, staff responses, and on-site asset settings before the risk window arrives. Machine learning models have demonstrated day-ahead ERCOT load forecast MAPE as low as 1.56, 1.66%. Arcobi's own backtest data covers 22 of 24 ERCOT 4CP days called correctly over a five-year period and 55 of 55 PJM 5CP days identified accurately over a ten-year backtest window.
A same-day alert often leaves insufficient time to shift significant load without disrupting operations. For facilities with large HVAC systems, batch manufacturing processes, or battery storage that needs to be repositioned, a 4-hour window is marginal. A 24-hour window is workable. A 7-day window with daily updates is where structured coincident peak avoidance becomes genuinely systematic rather than reactive.
What separates a reliable CP forecast from a basic temperature threshold
Naive approaches that flag high-risk days based solely on temperature fail frequently. Grid demand is shaped by humidity, cloud cover, industrial load patterns, economic activity, and transmission conditions that temperature alone doesn't capture. A system that triggers a CP alert every day above 95°F will generate so many false positives that operators stop responding, which defeats the purpose entirely.
Effective CP forecasting models combine weather variables, historical ISO load data, real-time SCADA telemetry, and machine learning trained on years of CP event records. The output is a graduated probability score across a risk ladder with watch, alert, and critical tiers, rather than a binary on/off signal. That tiered structure lets operations teams calibrate their response without over-curtailing on every hot afternoon. A "watch" level might trigger pre-cooling only; a "critical" level triggers full curtailment, generator activation, and battery discharge. The graduated signal makes the strategy both more accurate and more sustainable across a full summer season.
Automating coincident peak avoidance so nothing slips through
The final layer of a mature CP avoidance program is automation. Forecasting and strategy only produce savings when the response actually executes, and execution is where manual programs break down.
The manual approach breaks down at scale
Managing CP avoidance manually works in a simple environment: one facility, one ISO, a small team that watches the forecast every morning in summer. It breaks down the moment a C&I energy manager is responsible for multiple sites, multiple ISO markets, or facilities that can't afford human error during a high-probability event. The gap between a correct forecast and a missed event is almost always an execution failure, not a forecasting failure. Someone didn't see the alert, couldn't reach the right operator, or the load response came thirty minutes too late.
At scale, the problem compounds. A portfolio of ten industrial facilities across ERCOT and PJM faces up to nine CP events per summer, spread across different calendars, different alert thresholds, and different operational response protocols. Coordinating that manually requires either dedicated headcount or accepting that some events will slip through. Neither is acceptable when a single missed ERCOT 4CP interval, at $65, $80 per kW across a multi-megawatt load, can easily lock in $100,000 or more in transmission charges for the following year.
From forecast to automated load action: how Arcobi closes the loop
Arcobi's coincident peak avoidance module delivers days-in-advance probabilistic CP predictions across North American ISO markets, including ERCOT 4CP and PJM 5CP, without requiring energy managers to build or maintain their own forecasting models. The platform draws on more than 25 years of historical power market data and AI-driven forecasting to generate risk scores that update continuously as weather and grid conditions shift.
When a high-probability event is approaching, Arcobi converts that market signal into automated load coordination actions at the asset level, with configurable controls and a full audit record on every action taken. The manual fire drill disappears. The platform watches the grid continuously, scores CP risk in real time, and executes the response protocol the team has configured, whether that means curtailing non-essential loads, deploying battery storage, or delivering a prioritized action list to site operators with enough lead time to act. The entire chain from market data to asset-level response runs without requiring someone to catch an email at the right moment.
For C&I energy managers running on tight margins and tighter schedules, removing the guesswork from coincident peak management is the difference between capturing the savings the strategy promises and discovering after settlement that an event slipped through unchallenged. Arcobi's integrated stack spans market data, AI forecasting, real-time monitoring, and automated dispatch, keeping the avoidance program running in the background rather than consuming team bandwidth every August.
Building a CP management system that works every time
Coincident peak avoidance isn't complicated in principle: know when the grid peaks, reduce your demand at that moment, and repeat it consistently across every CP window in your market. The difficulty is execution. Forecasting accuracy, alert timing, operational coordination, and response consistency all have to work together, and they have to work every time. A single missed CP event in ERCOT or PJM can cost a facility more than an entire year of software investment.
The facilities that manage this well have moved from reactive monitoring to a structured system built on three interdependent capabilities. A reliable forecast with enough lead time to act on is the foundation; without it, even the best operational protocols fire on the wrong days.
A tiered response protocol scales the operational response to the probability level, preserving capacity for the highest-risk events rather than burning out the team on every hot afternoon. Automated execution removes the dependency on a person catching the right notification at the right moment. When those capabilities work together, coincident peak avoidance becomes a predictable, auditable business process rather than a high-stakes gamble on summer afternoons.
If you're evaluating how to build that system for your organization, start by quantifying your current CP exposure in ERCOT or PJM terms. The financial case usually makes itself once the numbers are on the table. Arcobi is built specifically for that workflow: forecasting, monitoring, and automated load coordination in one integrated stack designed for the complexity of North American ISO markets.
Some Related Cases
.png)



Let's explore your energy challenge together.
Every energy challenge is different. Tell us yours, and
we'll show you what 25 years of market intelligence can do.