

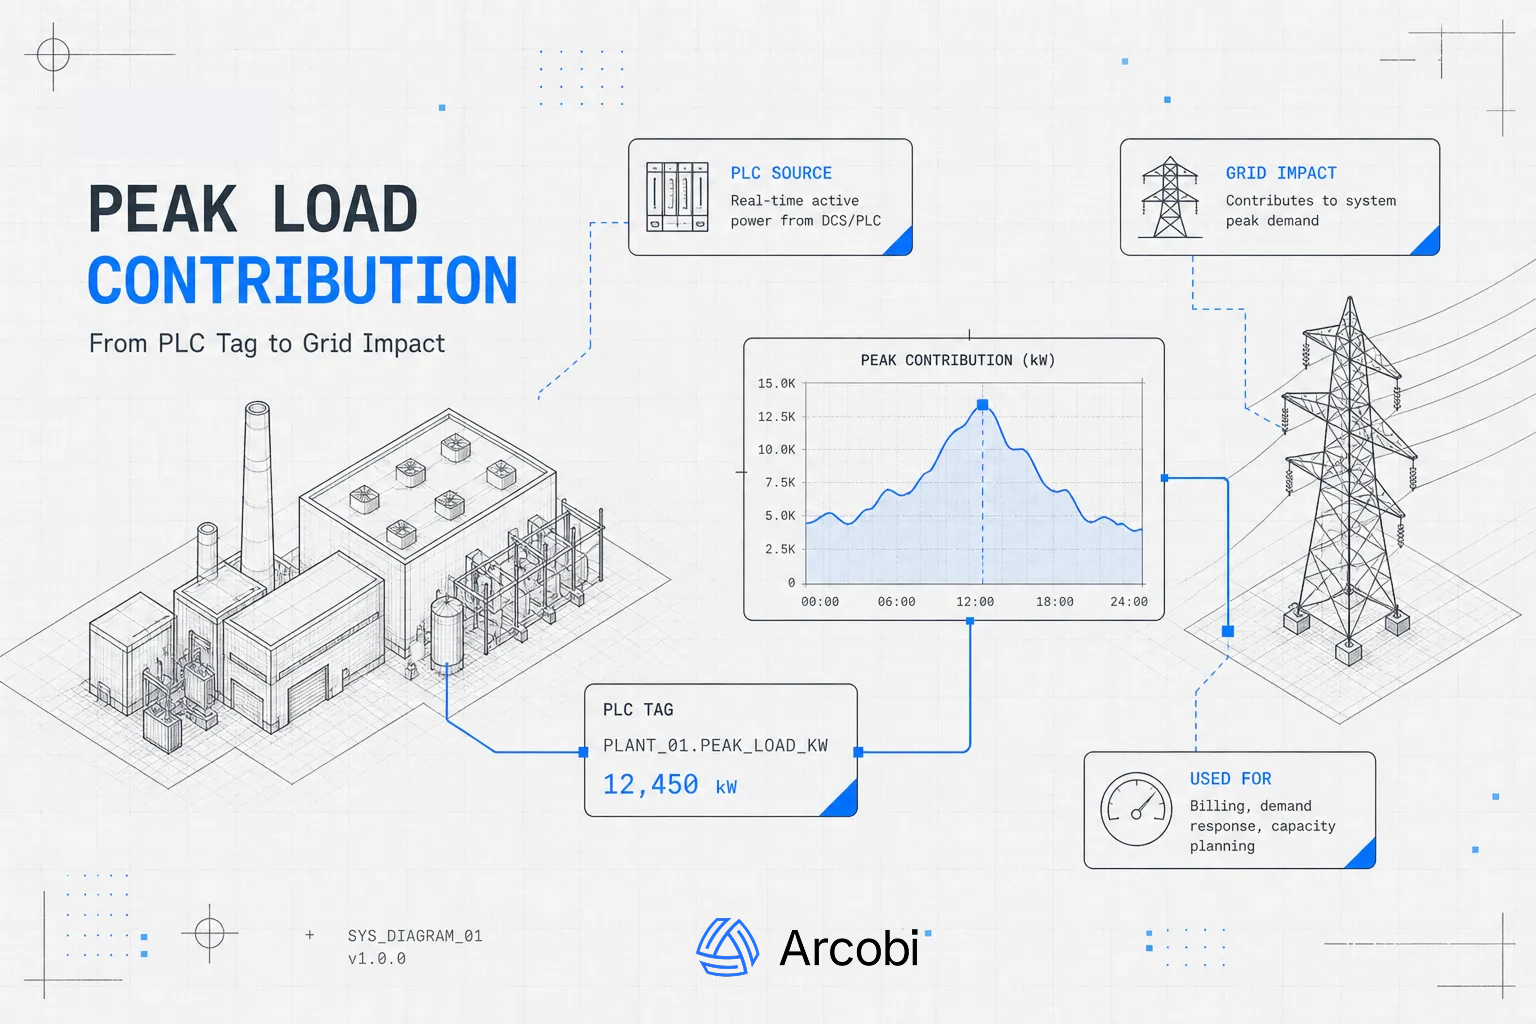
A handful of summer afternoons quietly determine what your facility pays in capacity and transmission charges for the next twelve months. Most energy managers know their bills are high; far fewer can point to the single number responsible for a large chunk of those costs. That number is your peak load contribution (PLC) tag, and once it's set, it follows your facility for an entire year.
This article covers what a PLC tag actually is, how your utility calculates it using the five coincident peaks method, what it costs in real dollars, and how to verify the math is right. More importantly, it walks through the operational strategies that reduce your coincident peak exposure before the measurement window closes. Arcobi is purpose-built to track peak load contribution tags and flag approaching peak hours so customers aren't caught off guard when it matters most.
What peak load contribution is and why utilities assign you a tag
The difference between your demand reading and your PLC tag
Your monthly electric bill includes a demand charge based on your facility's own highest usage interval during the billing period. A PLC tag works differently. It's a utility-assigned value that represents your facility's contribution to the regional grid's highest load periods, not your own peak. That distinction determines how much of the system's total capacity and transmission costs get allocated to your account each year.
Capacity PLC vs. network transmission PLC
In PJM territories, two separate tags affect your bill. The first is your capacity PLC, which allocates your share of the generation capacity obligation. The second is your network transmission PLC, which determines your share of Network Integration Transmission Service (NITS) costs. BGE, for example, calculates each tag separately: the capacity PLC uses PJM-designated peak capacity hours with a weather adjustment, while the transmission PLC uses PJM-designated transmission peak hours without that adjustment. A facility exposed to both tags is carrying compounded cost risk if load isn't managed at exactly the right moments.
Why this number follows you for an entire year
The PLC tag set from this summer's coincident peak hours becomes your billing basis for the following capacity year. In PJM, that year runs June through May. PJM typically publishes the five coincident peak dates in mid-October, after the summer measurement window has already closed. By the time most facilities see the number, the financial impact is already locked in.
The five coincident peaks method: how utilities calculate your tag
How PJM designates the five peak hours
PJM identifies the five highest system-wide peak hours across its entire footprint each summer, from June 1 through September 30. Each of the five peaks must fall on a different day, and weekends and holidays are excluded. These are the exact timestamps every PJM-zone utility uses to measure customer load for PLC purposes. PJM doesn't publish these dates until after the summer ends, which is precisely why proactive forecasting carries so much operational value.
Loss factors, reconciliation, and EDC-specific adjustments
The methodology most PJM-zone utilities follow has four steps: identify each customer's load at each of the five peak hours; apply a loss factor to gross up the metered read to a generation-level load; apply a reconciliation factor so the sum of all customer PLCs matches the zonal target; then average the five adjusted values to produce the PLC tag.
The specific loss and reconciliation factors differ by utility and customer class. Two facilities in different PJM zones with nearly identical load shapes can end up with meaningfully different tags because of these zone-specific inputs.
How BGE, PECO, and PPL apply the formula in practice
BGE derives both a capacity PLC and a transmission PLC from separate sets of five designated peak hours, with the capacity version applying a weather adjustment that the transmission version omits. PECO collects interval reads at the hour-ending times coincident with the highest PJM system peaks and uses those reads to establish each customer's contribution.
PPL averages the five adjusted summer peak loads across its June-through-September window. The underlying logic is consistent across zones; what varies are the reconciliation inputs, which is why facilities in different zones can see different tags even when their usage patterns look similar.
What your peak load contribution tag costs: turning a kilowatt number into annual dollars
Capacity charges tied to your PLC
PJM capacity market prices cleared at $269.92/MW-day for the 2025/2026 capacity year, translating to roughly $98.52 per kW per year at the RTO level. BGE cleared at $466.35/MW-day for that same year, approximately $170 per kW per year. For 2026/2027, PJM RTO cleared at $329.17/MW-day, putting the per-kW annual cost at roughly $120. A commercial facility with a 500 kW PLC tag in a mid-range zone is looking at $49,000 to $85,000 in annual capacity charges alone, before any transmission component is added.
Network transmission charges and why they compound
NITS charges add a separate cost layer, also tied to load during peak periods. These show up as a distinct line item on commercial bills, often referenced as the transmission PLC or NSPL in utility tariffs. The combined weight of capacity plus transmission charges means every kilowatt of unnecessary load during the five coincident peak hours carries a multiplied annual cost. The five hours that determine your PLC tag represent a fraction of the year's operating hours but drive a disproportionate share of your annual electricity spend.
Why the stakes are higher than most facilities realize
For a large commercial or industrial account, a 100 kW reduction in load during the five coincident peak hours translates directly to tens of thousands of dollars in avoided capacity and transmission costs over the following twelve months. That math applies every year the tag is in effect. A facility that consistently manages its coincident peak exposure compounds those savings over time, while one that doesn't gets repriced upward with each renewal cycle.
How to verify your PLC calculation is correct
The meter records and interval data you need
Verifying your peak load contribution requires three pieces of information: the exact timestamps PJM designated as the five coincident peak hours for that summer, your own interval meter data at those timestamps, and your utility's stated loss factor and reconciliation factor for your zone and customer class. Without all three, you can't reconstruct the utility's calculation independently, and you have no factual basis for a dispute.
Checking the utility's inputs for errors
The most common errors that inflate PLC tags include the wrong service classification, an incorrect loss factor, a timezone or daylight-saving misapplication that shifts which hour-ending read was captured, and the use of a load profile estimate instead of actual interval data for accounts that are interval-metered. Each of these errors is catchable by comparing the utility's hourly load values at the five peak hours against your own MDMS or AMI export for those exact timestamps.
When and how to escalate a dispute
If your interval reconstruction shows a material discrepancy, you can formally request the utility's PLC derivation under applicable tariff rules. Ask specifically for the hourly load values at each of the five peak hours, the loss factor applied, the reconciliation factor, and the basis for any load profile used in place of actual interval data. Most PJM-zone tariffs require disputes to be filed within a defined window after the tag is published, so timing is a real constraint.
Reducing your peak load contribution before the measurement window closes
Operational strategies with documented impact
The primary levers for reducing coincident peak exposure are demand response curtailment, HVAC setpoint adjustments during high-risk periods, shifting discretionary loads outside the likely peak window, and dispatching on-site generation or battery storage during the highest-risk summer hours. A 2019 Lawrence Berkeley National Laboratory report on price-responsive demand found that weekday peak-period load reductions averaged 26% during summer months, with reductions reaching 50% during critical price events. A PJM 2018 load forecast report noted that shifting approximately 1.7% of total MWh to off-peak hours captured half of the available savings from load shifting, which means even modest operational changes carry outsized financial impact on coincident peak exposure.
Why forecasting is the most critical input
The core challenge with peak load contribution reduction is that the five coincident peak hours aren't known until after summer ends. Acting effectively requires forecasting which days and hours are most likely to be designated, with enough lead time to pre-position loads, schedule curtailment, and dispatch storage.
Arcobi is built specifically for this workflow. The platform tracks each customer's current PLC exposure, runs AI-driven demand and LMP forecasts to identify high-probability peak hours days in advance, and alerts operations teams before the measurement window opens. By combining historical 5CP pattern analysis with multi-horizon price and demand forecasting, Arcobi gives customers the lead time they need to act rather than react.
A repeatable curtailment workflow for demand response and energy storage
Knowing a peak is approaching is only useful if there's a defined response waiting for it. A practical curtailment workflow typically unfolds in five steps:
- Receive a peak forecast alert 24 to 48 hours out.
- Confirm which loads are deferrable.
- Pre-cool the facility to buffer HVAC curtailment during the flagged hours.
- Pre-charge any on-site storage.
- Execute the load reduction when the window opens.
Repeated consistently across a full summer, disciplined execution against a reliable forecast can reduce a facility's PLC tag significantly, with the dollar impact compounding through the following capacity year.
Start managing peak load contribution before it manages your budget
Peak load contribution isn't a billing technicality buried in a tariff schedule. It's one of the most leverageable cost variables in a commercial energy budget, and the window to influence it is shorter than most facilities realize. Once you understand that your PLC tag is set by a handful of summer hours, the path to lower capacity and transmission costs becomes concrete: verify the calculation, understand the formula your EDC applies, and build a curtailment plan anchored to credible peak forecasts.
Arcobi is purpose-built for exactly this workflow. The platform connects 25-plus years of North American power market data, AI-driven peak forecasting, and real-time operational alerts into a single integrated stack designed to help commercial and industrial customers manage their coincident peak exposure before the summer ends. If you're carrying a PLC tag you haven't actively managed, you're leaving a measurable amount of money on the table every year.
Ready to see what your peak load contribution exposure looks like and when this summer's peak hours are most likely to fall? Learn how Arcobi tracks coincident peak risk for your facility and puts a curtailment plan in place before the window closes.
Some Related Cases
.png)



Let's explore your energy challenge together.
Every energy challenge is different. Tell us yours, and
we'll show you what 25 years of market intelligence can do.