

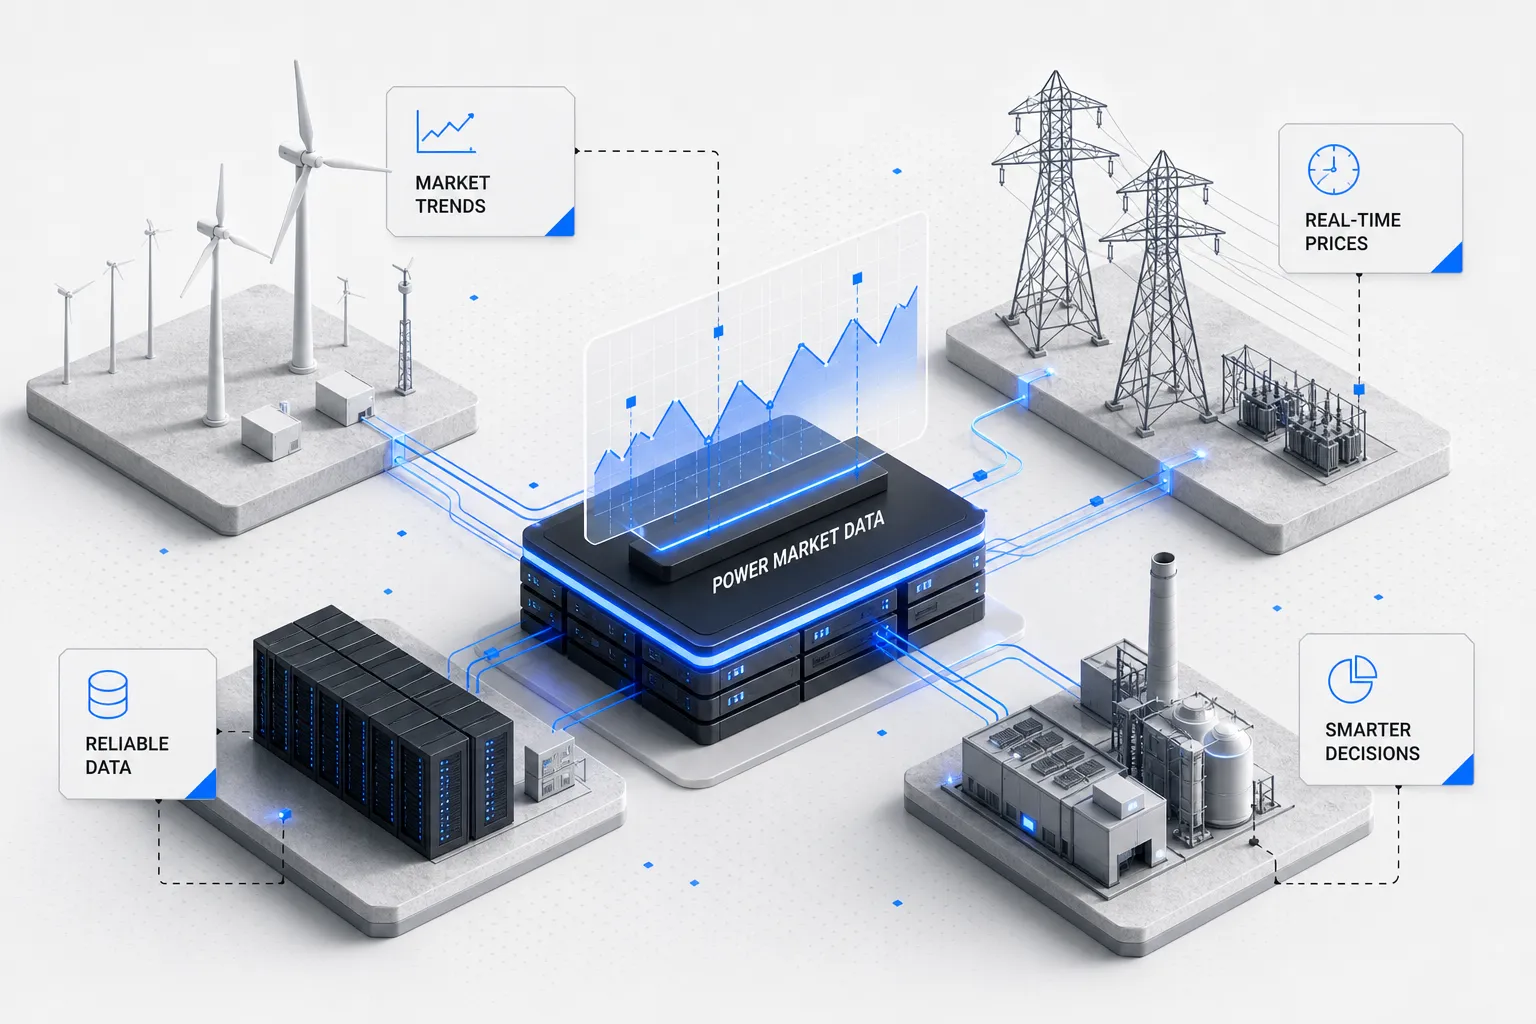
Energy decisions made without complete, accurate market data aren't decisions. They're guesses. A trader pricing a bid stack, an asset operator planning battery dispatch, a C&I buyer trying to avoid a coincident peak charge, each is only as good as the data underneath their analysis. The problem isn't that power market data doesn't exist. It's that many organizations still access it through fragmented, incomplete sources, or spend months building pipelines to consolidate what they actually need.
This guide breaks down exactly what electricity market data covers, why quality and historical depth are non-negotiable, and how to match the right data source to your specific role in the market. By the end, you'll have a clear picture of where to start and what to prioritize.
What power market data actually covers
Power market data is not a single feed. It's a collection of distinct data types, each serving a different analytical function and originating from a different part of the wholesale electricity system. Understanding the difference between these data types is the first step toward using them correctly.
LMP and nodal price data
Locational Marginal Prices (LMPs) are the most widely referenced signal in wholesale power markets. Each ISO publishes day-ahead (DA) and real-time (RT) LMPs at thousands of pricing nodes, PJM alone registers over 10,000, broken into three components: energy, congestion, and marginal losses. Real-time markets typically clear every five minutes, while day-ahead LMPs are calculated hourly for the following operating day. Understanding nodal spreads is critical for congestion management, nodal hedging, and LMP forecasting, and it's what distinguishes market participants who react from those who anticipate.
Load data and demand patterns
Load data captures actual electricity consumption across the grid, published at hourly or sub-hourly intervals by each balancing authority, CAISO and ERCOT, for example, report at five-minute resolution. It includes total system load, zonal load breakdowns, and demand forecasts. Load shapes drive price formation, making demand data inseparable from any price analysis worth running.
Generation mix and fuel source data
Generation mix data shows how much electricity is being produced by each fuel type: natural gas, coal, nuclear, wind, solar, and hydro. This directly affects marginal cost and therefore LMPs. It also tracks renewable penetration, curtailment events, and the real-time generation stack that sets clearing prices at any given moment.
Ancillary service prices and capacity market results
Ancillary services include regulation, spinning reserves, and operating reserves. Each ISO runs separate markets for these products and publishes clearing prices alongside energy market results, typically including cleared quantity in megawatts, product type, and interval-level pricing. Capacity market data, particularly from forward auctions like PJM's Reliability Pricing Model, adds another layer: long-term supply adequacy signals that affect investment decisions and asset valuation across delivery years.
Why data quality and historical depth are non-negotiable
Access to electricity market data and access to clean electricity market data are two different things. The gap between them is where analytical errors live, and in energy markets, those errors carry a direct financial cost.
The real cost of bad data
Dirty data includes missing intervals, mismatched timestamps, incorrect node mappings, and values that weren't properly restated after ISO corrections. Any of these errors can silently corrupt a backtest, skew a forecast, or produce a dispatch signal that looks rational but isn't. The failure mode is often invisible until the settlement statement arrives or a model recommendation turns out to be wrong in a costly direction. ISO restatement policies vary by market, and without a data provider that tracks and applies those corrections retroactively, historical records can carry silent errors for months.
What historical depth unlocks
Depth matters as much as quality. A dataset spanning 25 or more years of North American power market history captures multiple grid regimes, fuel price cycles, extreme weather events, and regulatory shifts, events like the 2011 Southwest blackouts, the 2014 Polar Vortex price spikes across PJM, and the structural changes that followed FERC Order 745. That depth is what makes model training meaningful and backtesting credible. One or two years of clean data isn't enough to validate a strategy designed to hold up across volatile market conditions. It's worth noting that free government datasets, such as EIA hub-level series, have start years that vary by hub, some going back to 2001, others not until 2009 or later, so multi-decade, node-level coverage often requires commercial aggregation. The more complete the historical record, the more confidence you can place in forward projections built from it.
Real-time feeds vs. historical datasets: knowing when you need each
Real-time data and historical data serve completely different operational functions. Mixing up which one you need is a common and expensive mistake, and most organizations actually need both running in parallel.
When real-time feeds drive action
Automated dispatch systems, intraday trading desks, and demand response controllers all operate on live data. Real-time electricity prices updated every five minutes, combined with live generation and load signals, are what allow a battery storage system to decide whether to charge or discharge right now. For these use cases, latency is the variable that matters most. Data delivered seconds after ISO publication is useful; data delivered 20 minutes late is often irrelevant.
ISO-NE posts provisional real-time prices within minutes of the operating interval. CAISO's OASIS API refreshes market data every five minutes. Pulling directly from those portals at scale, however, requires engineering resources most teams don't want to allocate to data plumbing.
When historical depth builds confidence
Forecasting models, portfolio analysis, capacity planning, and regulatory filings all depend on historical datasets. A quantitative researcher backtesting an LMP forecasting model across PJM nodes needs years of hour-by-hour electricity price curves, not a live ticker. Settlement dispute analysis, rate case preparation, and long-term contracting decisions similarly require data that goes back far enough to be statistically meaningful. The two modes, real-time and historical, are complements, not substitutes. Any production-grade energy analytics environment needs both.
Where this data originates: ISOs, government sources, and commercial feeds
Market data comes from multiple origin points, and each source carries different coverage, latency, and usability trade-offs. Knowing those trade-offs prevents teams from over-investing in free sources that can't support production use, or paying for commercial feeds they don't actually need.
ISO and RTO portals as primary sources
Every major ISO and RTO publishes market data directly. ERCOT, PJM, MISO, CAISO, NYISO, ISO-NE, and SPP all maintain public portals with LMP data, load reports, generation mix, and ancillary service clearing prices. The data is authoritative by definition. The problem is delivery: it arrives in inconsistent formats, across dozens of separate reports, with varying historical depth and no unified schema. CAISO uses XML via its OASIS download API. ISO-NE offers XML and JSON via web services. PJM and MISO have their own report structures and update cadences. Accessing these systematically requires either significant engineering effort or a third-party aggregator.
Government and commercial options
The EIA publishes wholesale power prices and volume data for major hubs, with some series going back to 2001, though start years vary by hub, and updates the feed biweekly. The Berkeley Lab WEP Tool offers additional analytical views on wholesale prices. These are useful starting points for exploratory work. They rarely hold up for production-grade trading or forecasting environments, where data freshness, completeness, and consistency are operational requirements rather than nice-to-haves.
Commercial API providers offer structured power trading data feeds with better latency and delivery consistency, typically via REST APIs. Pricing is subscription-based, coverage varies by market, and most still require integration work to normalize data across ISOs. The gap between what free sources provide and what production workflows demand is where most teams lose time and money.
Accessing 25+ years of power market data without building your own pipelines
The real barrier most organizations hit isn't finding market data. It's consolidating, cleaning, and delivering it at the scale and depth their workflows actually require, without consuming engineering resources that should be focused on analysis.
The pipeline problem
Building a production-grade data pipeline means connecting to a dozen ISO portals, handling format inconsistencies, managing restatements and corrections, maintaining historical archives, and keeping everything updated in real time. For a data engineering team, this can take months to build and more months to stabilize. For analysts and traders who need the data to do their jobs, that overhead is an obstacle that shouldn't exist.
Want to skip the pipeline entirely? Explore Arcobi's DataHub and query your first dataset today.
How Arcobi's DataHub eliminates that overhead
Arcobi's self-service DataHub is designed to give energy market participants direct access to more than 25 years of North American power market data across all major ISO and RTO regions, including PJM, ERCOT, MISO, CAISO, NYISO, ISO-NE, and SPP. According to Arcobi's product specifications, the data is cleaned, normalized, and continuously updated, covering LMP prices, load data, generation mix, ancillary service clearing prices, and capacity market results. The platform is built so analysts can query what they need, in the format they need it, and use it immediately in their models, dashboards, or automated systems, without standing up a bespoke ingestion layer first.
For teams that need both historical depth and real-time feeds in the same environment, that combination is rare. Most alternatives force teams to maintain two separate systems, one for backtesting, one for live decisions. Arcobi connects both into a single layer, so analysts can backtest against the same data infrastructure that drives live decisions. Verify the specifics via a demo or trial to confirm fit with your stack.
Matching your data needs to your role in the market
The right market data strategy depends on what decisions you're making and how fast you need to make them. A one-size-fits-all approach doesn't work here, and trying to force it wastes both budget and time.
What different roles actually need
Different roles demand very different data profiles. Here's how those requirements break down in practice:
- Energy traders and quantitative researchers need deep historical LMP and load datasets with high granularity, reliable API delivery, and consistent node-level coverage for backtest validation.
- IPPs and utilities need multi-market visibility across both real-time signals and forward curves to align dispatch with market conditions across ISO boundaries.
- C&I energy buyers need load data and price forecasts tied to their specific billing regions, particularly around coincident peak windows, where a single wrong decision locks in transmission charges for an entire year.
- Battery storage and generation asset operators need real-time price signals connected directly to dispatch execution, with configurable controls and a full audit trail on every automated action.
Each use case has a different data profile. Trying to serve all of them with a single free government feed is a shortcut that eventually fails, often at the moment it's most costly.
A practical starting point
Start by identifying the decisions you make most frequently and map each to the data type it requires. If your decisions are operational and time-sensitive, prioritize real-time feeds with low latency. If your decisions are strategic, historical depth and data quality matter more than refresh rate. And if you're spending more time managing data infrastructure than analyzing it, that's the signal to consolidate. Clean, complete electricity market data shouldn't be the bottleneck in your workflow. It should be the foundation everything else is built on.
The data underneath every decision
Power market data is the common input to every decision made in wholesale electricity markets, from a five-minute dispatch call to a multi-year capacity investment. The sophistication of that data, its completeness, historical depth, accuracy, and delivery mechanism, determines the quality of the decisions built on top of it. Free government sources and ISO portals are useful starting points but rarely sufficient for production-grade use.
Purpose-built energy intelligence platforms like Arcobi close the gap by delivering more than 25 years of clean, structured North American electricity market data through a self-service DataHub. If you're ready to stop patching together fragmented sources and start working from a single, reliable foundation, reach out to the Arcobi team to see the DataHub in action.
The question isn't whether you need power market data. The question is whether the data you're working with is good enough to trust.
Frequently asked questions
How current are LMP data feeds?
Real-time LMP feeds from ISOs like CAISO and ISO-NE refresh every five minutes, typically posting provisional prices within minutes of the operating interval. Commercial platforms that aggregate these feeds add their own ingestion and delivery latency on top of that, so when evaluating a provider, ask for their end-to-end latency from ISO publication to API availability.
How is historical power market data corrected after ISO restatements?
ISOs periodically restate historical prices to correct for metering errors, settlement disputes, or calculation adjustments. A production-grade data provider should track these restatements and apply them retroactively to archived records. If a provider doesn't have a documented restatement policy, assume your historical data may carry silent errors.
What's the difference between day-ahead and real-time LMPs?
Day-ahead LMPs are calculated in the forward energy market for each hour of the next operating day. Real-time LMPs reflect actual grid conditions and clear every five minutes during the operating interval. Both are essential: day-ahead prices inform bidding strategy and hedging, while real-time prices drive dispatch and settlement.
Do I need wholesale power prices going back 25 years, or is recent data enough?
It depends on your use case. For operational forecasting with a short horizon, two to three years of clean data may be sufficient. For model training, backtesting, or long-term asset valuation, especially for strategies that need to hold up across fuel price cycles, extreme weather events, and regulatory changes, multi-decade coverage is often necessary to produce statistically meaningful results.
Some Related Cases




Let's explore your energy challenge together.
Every energy challenge is different. Tell us yours, and
we'll show you what 25 years of market intelligence can do.
