
A facility runs one piece of heavy equipment during an unplanned 15-minute window on a hot August afternoon. The operations team thinks nothing of it. Then the electricity bill arrives, and a single line item is, in some documented cases, 40% higher than the previous month. Worse, that number doesn't reset. It follows the facility for the next 12 months, locked in by tariff mechanics most energy managers have never fully read. That is how transmission demand charges work, and that is why understanding the math behind them is one of the highest-value things a large energy user can do.
Most facility and energy managers know demand charges exist as a general concept. Far fewer understand how billing demand is actually measured, what ratchet clauses do to a monthly floor, or how coincident peak assignment in a market like PJM can quietly inflate their transmission costs for an entire delivery year. This article breaks all of it down: the calculation method, the tariff features that amplify exposure, the industries hit hardest, and the operational strategies that consistently bring these charges down.
How Transmission Demand Charges Are Actually Calculated
The single distinction that trips most people up is the billing unit. Transmission demand charges are priced in dollars per kilowatt ($/kW), not per kilowatt-hour. Energy charges bill you for how much electricity you consumed over the month. Demand charges bill you for the maximum rate at which you drew power during a defined interval, typically 15 minutes. Those are fundamentally different metrics, and conflating them is how facilities end up surprised by a bill that doesn't reflect how little they used the rest of the month.
The core formula is straightforward: billing demand (kW) multiplied by the transmission demand rate ($/kW) equals the transmission demand charge. Consider a facility that hits 800 kW during one 15-minute window and faces a rate of $10/kW.
That produces an $8,000 monthly transmission charge, regardless of whether the rest of the month was quiet. Based on publicly filed tariff schedules from PJM-zone utilities such as PECO and PSE&G, transmission demand rates for large commercial and industrial (C&I) customers typically range from roughly $1.75/kW to over $10/kW per month depending on zone, meaning the stakes scale quickly with facility size.
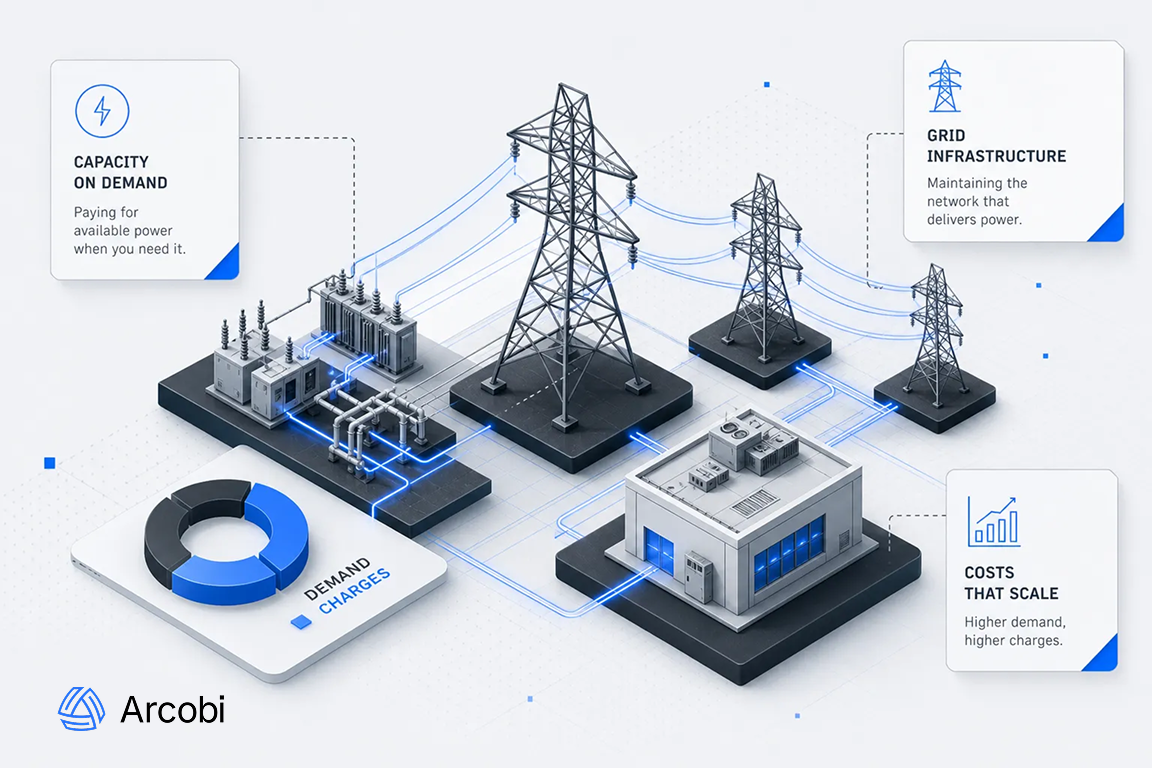
The charge exists because utilities must build grid infrastructure to handle a customer's maximum demand, not their average. So the billing is sized to that worst-case draw, and the customer pays to hold that capacity reservation every month whether they use it or not.
For large C&I facilities, transmission and distribution demand charges combined commonly represent a substantial share of total electricity costs, Lawrence Berkeley National Laboratory research on large commercial customers puts the figure between roughly 30% and 50% in many utility territories, with higher shares for industrial customers in dense-grid markets.
The Single-Hour Trap: Ratchets and Coincident Peak Billing
A basic demand charge is already unforgiving, but two common tariff features make the exposure significantly worse: ratchet clauses and coincident peak billing. Either one alone can cause serious cost volatility. Together, they create a situation where one bad hour in August is still showing up on bills in February.
How Demand Ratchets Lock In Your Worst Month
A demand ratchet clause means the utility does not simply measure your peak demand each month and bill that. Instead, the bill is calculated as the greater of the current month's peak or a set percentage of the highest peak recorded over the previous 11 to 12 months. The most common threshold in U.S. utility contracts is 80%, though many tariffs run anywhere from 60% to 90%. If a facility hits 1,200 kW in July, an 80% ratchet sets a billing floor of 960 kW for every subsequent month through the following summer, even if actual peaks drop to 500 kW. The ratchet doesn't care about operational improvement; it only cares about the prior high-water mark.
How Coincident Peak Billing Extends That Exposure Across a Delivery Year
Coincident peak billing adds a second layer that is harder to control because it is defined by the grid, not the facility. In PJM, a customer's Peak Load Contribution (PLC), a capacity metric used to allocate network and capacity costs, is calculated from the average of their measured demand during the five highest system-wide peak hours of the summer. Those five hours are identified only after the fact.
Per PJM's Open Access Transmission Tariff and related EDC tariff schedules, this PLC figure then drives capacity and certain transmission-related charges for the subsequent delivery year. A facility running at full capacity during one of those hours gets assigned a higher PLC tag that influences transmission and capacity costs for the entire following year. There is no way to go back and fix a missed curtailment after the window closes.
When a tariff includes both a ratchet and coincident peak billing, the compounding effect is severe. One high-demand summer event can simultaneously set a 12-month ratchet floor and a higher PLC, both running in parallel across the same billing period. This timing window is why effective avoidance tools, including Arcobi's, are built around the pre-event window: day-ahead and real-time alerts give facilities and automated systems the lead time they need to reduce load before the meter captures the wrong moment.
Which Facilities Face the Highest Transmission Demand Charge Exposure
The key variable is load factor, the ratio of a facility's average demand to its peak demand. A facility with a low load factor spikes high but runs light most of the time, which means its infrastructure reservation is disproportionately large relative to what it actually uses. These facilities pay the most per unit of energy because the demand charge is sized to the spike, not the average.
Several industries fit this profile consistently. Manufacturing plants with large motors, startup inrush current, and process load swings create pronounced peaks that may last only minutes but define the billing demand for the month. Cold storage facilities face compressor cycling, defrost loads, and multi-unit startups that can concentrate demand into a short window.
Large commercial buildings and big-box retail see HVAC and lighting peaks that align with hot weather and business hours, making their worst moments predictable in timing but hard to avoid without automation. Data centers run a high, relatively flat load profile, but because they operate around the clock and have limited ability to curtail load during grid peak events, their coincident peak exposure can be disproportionately high relative to customers that can flex demand.
For all of these facility types, transmission demand charges are not a footnote in the billing breakdown. For many large C&I customers, they represent the largest single controllable cost on the bill, and the one with the most leverage for reduction when the right operational changes are in place.
How These Charges Appear on a Commercial Utility Bill
Many facility managers see "demand charge" as one undifferentiated line item. In reality, commercial utility bills often separate transmission demand charges, distribution demand charges, and energy charges into distinct components with different rates and different mechanics.
Energy charges cover total kWh consumed. Distribution demand charges fund the local wires, transformers, and substation equipment that deliver power to the meter. Transmission demand charges fund the high-voltage bulk power grid that moves power across regions. The $/kW rates for each are set by separate tariff schedules and governed by different regulatory bodies.
In deregulated markets like Texas (ERCOT), this structure takes a specific form. Transmission and distribution charges flow through the TDU or TDSP (Transmission and Distribution Service Provider) as pass-through costs that appear on the bill regardless of which retail electric provider a customer has chosen.
These are frequently misread as generic utility fees, but they carry the same demand-billing mechanics described above. Identifying, isolating, and understanding these line items on the actual bill is the first operational step toward managing them. You can't reduce a charge you haven't located and quantified.
Proven Strategies to Reduce Your Demand Charge Exposure
Load Shifting and Smart Scheduling
The most accessible starting point for most facilities is load shifting and staggered equipment startups. Moving flexible, high-draw loads to off-peak hours and ensuring that multiple large pieces of equipment don't start simultaneously can make a meaningful difference without capital expenditure.
According to ACEEE analyses of demand flexibility programs, software-driven load staggering and smart scheduling have demonstrated demand charge reductions in the range of 15, 35%, though realized savings depend heavily on how much scheduling flexibility the operation actually has. The constraint is timing: load shifting only works if you know in advance when the high-risk billing windows are likely to occur, which requires day-ahead price and demand forecasting.
Battery Storage for Peak Demand Capping
Battery storage is the most direct technical solution for demand charge reduction. A properly sized battery system charges during low-demand periods and discharges during peak windows to cap the facility's maximum demand reading at a target threshold.
Rocky Mountain Institute and NREL case studies on C&I storage deployments report peak demand reductions of 30, 50% at sites where storage was specifically sized and dispatched for demand charge management. Payback periods vary significantly based on local demand charge rates, utility interconnection costs, and available incentives. For many large facilities, the range runs 4, 7 years, while those in high-rate markets with available state or utility incentives have seen payback periods closer to 3, 5 years.
Demand Response Participation
Demand response participation adds a second layer of protection, particularly for coincident peak exposure. Facilities that curtail or reschedule load during system peak events reduce their PLC in coincident-peak markets and often receive direct bill credits or capacity payments for the curtailment.
The practical challenge is that manual curtailment is slow. By the time a human operator reads a weather alert, communicates the response to the floor, and begins load reduction, the 15-minute billing interval may already be captured. Automated load control systems that respond within seconds of an alert are substantially more effective than manual processes for this reason.
On-site generation, including solar, combined heat and power (CHP), and backup generators, can reduce net peak demand when paired with storage and automated controls. On-site generation alone doesn't eliminate demand charges, because the utility still sees the facility's net draw at the meter. But as part of a broader stack that includes battery storage and automated dispatch, it adds a meaningful buffer for facilities with available roof or land area.
Why Manual Load Management Fails, and What Automation Changes
The fundamental problem with manual demand management is that the billing windows are short and the identification of high-risk periods is often delayed. Coincident peak hours in PJM are identified only after the event. Weather alerts are directional, not precise.
The gap between a decision to curtail and actual load reduction at the facility level introduces latency that can easily exceed the 15-minute window that determines billing demand. A single equipment startup that wasn't communicated to the energy team, or one afternoon when the alert wasn't seen in time, can set a billing floor that runs for 12 months.
This is the operational gap that Arcobi is built to close. The platform uses AI-driven day-ahead forecasting to flag high-risk coincident peak windows across major ISO/RTO markets before they occur, giving operations teams and automated systems enough lead time to pre-position loads or stage curtailment.
Real-time monitoring connects market intelligence directly to facility-level actions, with configurable controls and a full audit trail on every step taken. For large C&I users facing hundreds of thousands of dollars per year in transmission demand charges, closing this 15-minute timing gap with automation is consistently among the highest-return operational changes available. The stakes are clear: in PJM, missing a single coincident peak hour can add more annual cost than many efficiency upgrades save over the same period.
Transmission Demand Charges Are Manageable, but Only with the Right Systems
Transmission demand charges are structurally punishing because the math is unforgiving. One peak moment, multiplied across 12 months of ratchet exposure or a coincident peak assignment, can cost far more than any other single operating variable a facility controls in a given year. The good news is that these charges respond directly to operational discipline. Understand how your billing demand is measured. Know when your tariff's highest-risk windows occur. Have systems in place to respond before the meter captures the wrong interval.
The facilities that reduce these charges most consistently treat peak avoidance as a continuous operational process, not a reactive fire drill. That requires day-ahead intelligence on high-risk windows and automated load response that doesn't depend on a human catching an alert in time. Real-time monitoring that ties market signals directly to facility-level actions closes the loop. Understanding the mechanics described in this article is the first step. Having the tools to act on them before the billing window closes is what separates the facilities that manage these charges from the ones that absorb them.
Some Related Cases
.png)

Let's explore your energy challenge together.
Every energy challenge is different. Tell us yours, and
we'll show you what 25 years of market intelligence can do.