.png)

The Productivity Divide: Why the Most Productive Companies Keep Pulling Away
LNS Research just published its 2026 Industrial Productivity Index and World’s Most Productive Companies, benchmarking total factor productivity across more than 600 publicly traded industrials in 10 industries. The headline is encouraging: "After a year of tariffs, supply disruptions, and a once-in-a-generation AI investment cycle, aggregate industrial productivity returned to growth in 2025."
But the headline is the least interesting part of the data. The real story is the separation.
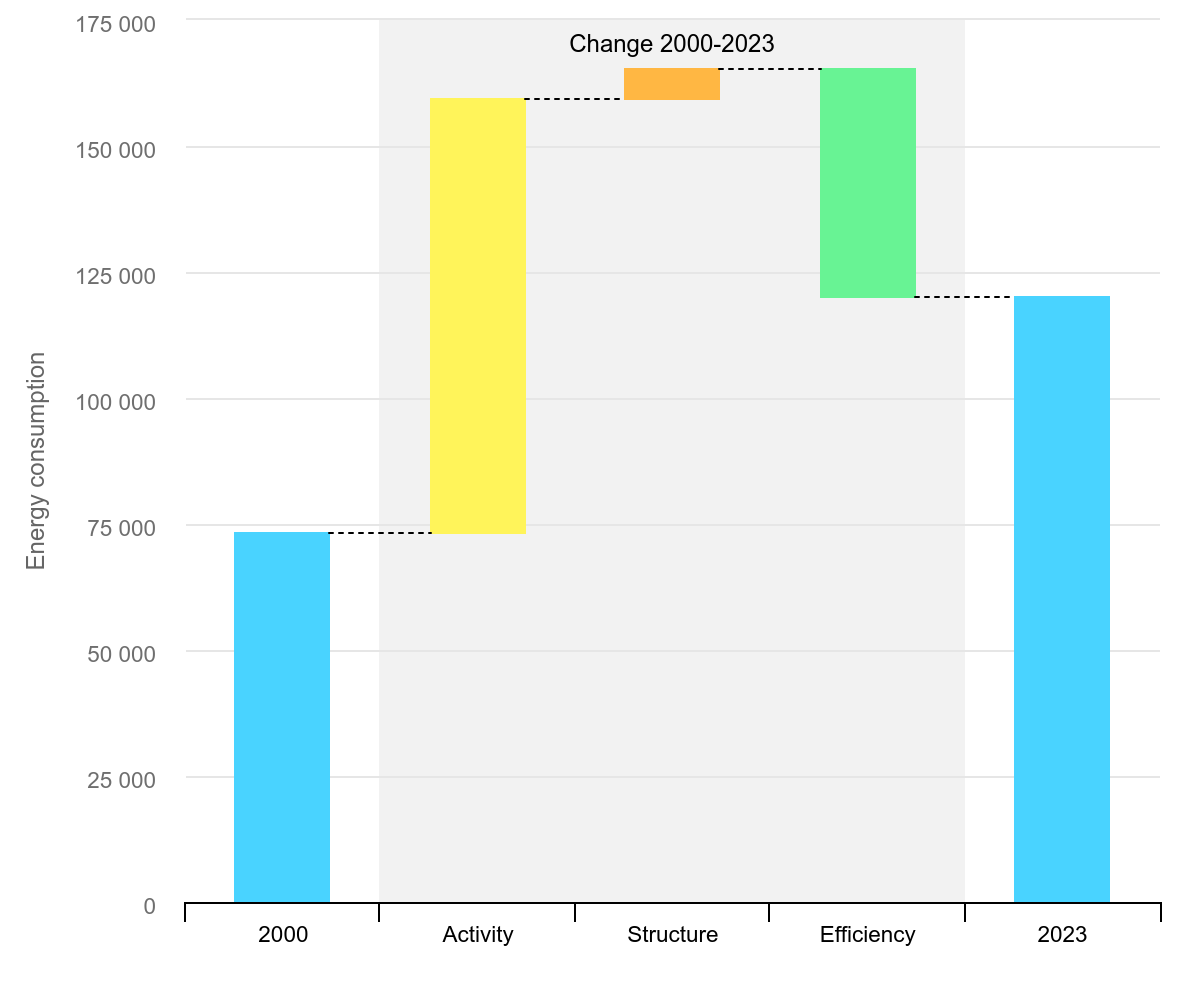
Since 2019, the top 30 companies (what LNS calls Productivity Pathfinders) are up more than 28% on arevenue-weighted basis. The top 100 are up about 25%. The other 512 companies?Roughly 3% over six years, and most of that came from the 2021-2022 cyclicalrecovery that has since faded.
We're not looking at a simple performance gap; these are entirely separate trajectories.
Two Flywheels, Spinning in Opposite Directions
What struck me most in the research is the mechanics of the gap. For companies falling behind, weaker productivity compresses margin and cash, which leaves less to reinvest in the capability, technology, and talent that would restore it. Capability erodes a little further, productivity slips again, and next year starts from a lower base. None of the steps look dramatic. Each one resembles ordinary cost management. That’s exactly why the loop is so hard to break.
For the leaders, the same mechanism runs in reverse. Productivity gains generate the margin and cash that fund the next round of investment, which raises capability and produces the next gain. The lead becomes self-funding. As LNS puts it, these companies aren’t running the same race a few steps ahead; they’re reinvesting their advantage faster than the field can close it.
“They are not running the same race a few steps ahead — they are reinvesting their advantage faster than the field can close it.” — LNS Research, 2026 Industrial Productivity Index
I see the same dynamic in powermarkets every day. Volatility doesn’t punish everyone equally. It punishes operators who can’t see around corners and rewards the ones who can.Compounding advantage is not a financial abstraction. It’s an operating reality.
The Energy Expansion Is Written into the Data

Break down the index by industry and the energy expansion story becomes clear. High Tech is up roughly 39% since 2019, carried by semiconductors, AI infrastructure, and advanced electronics — the very demand signals reshaping our grids.
Energy itself has recovered to about 8% above its 2019 level, led by integrated and midstream operators. Meanwhile, the materials- and energy-intensive sectors (chemicals, food andbeverage, materials) remain below their 2019 baselines, weighed down in part by input-cost pressures.
Read those three facts together and the message is that the most productive industries are the ones building and powering the digital economy, and energy cost and reliability increasingly separate winners from losers everywhere else. Productivity and power are no longer separate conversations. The IEA’s analysis on energy demand and industrial competitiveness puts it as energy costs are now a primary determinant of long-term investment and competitive position. They’re the same conversation.
Operating Models Built for a Slower Era
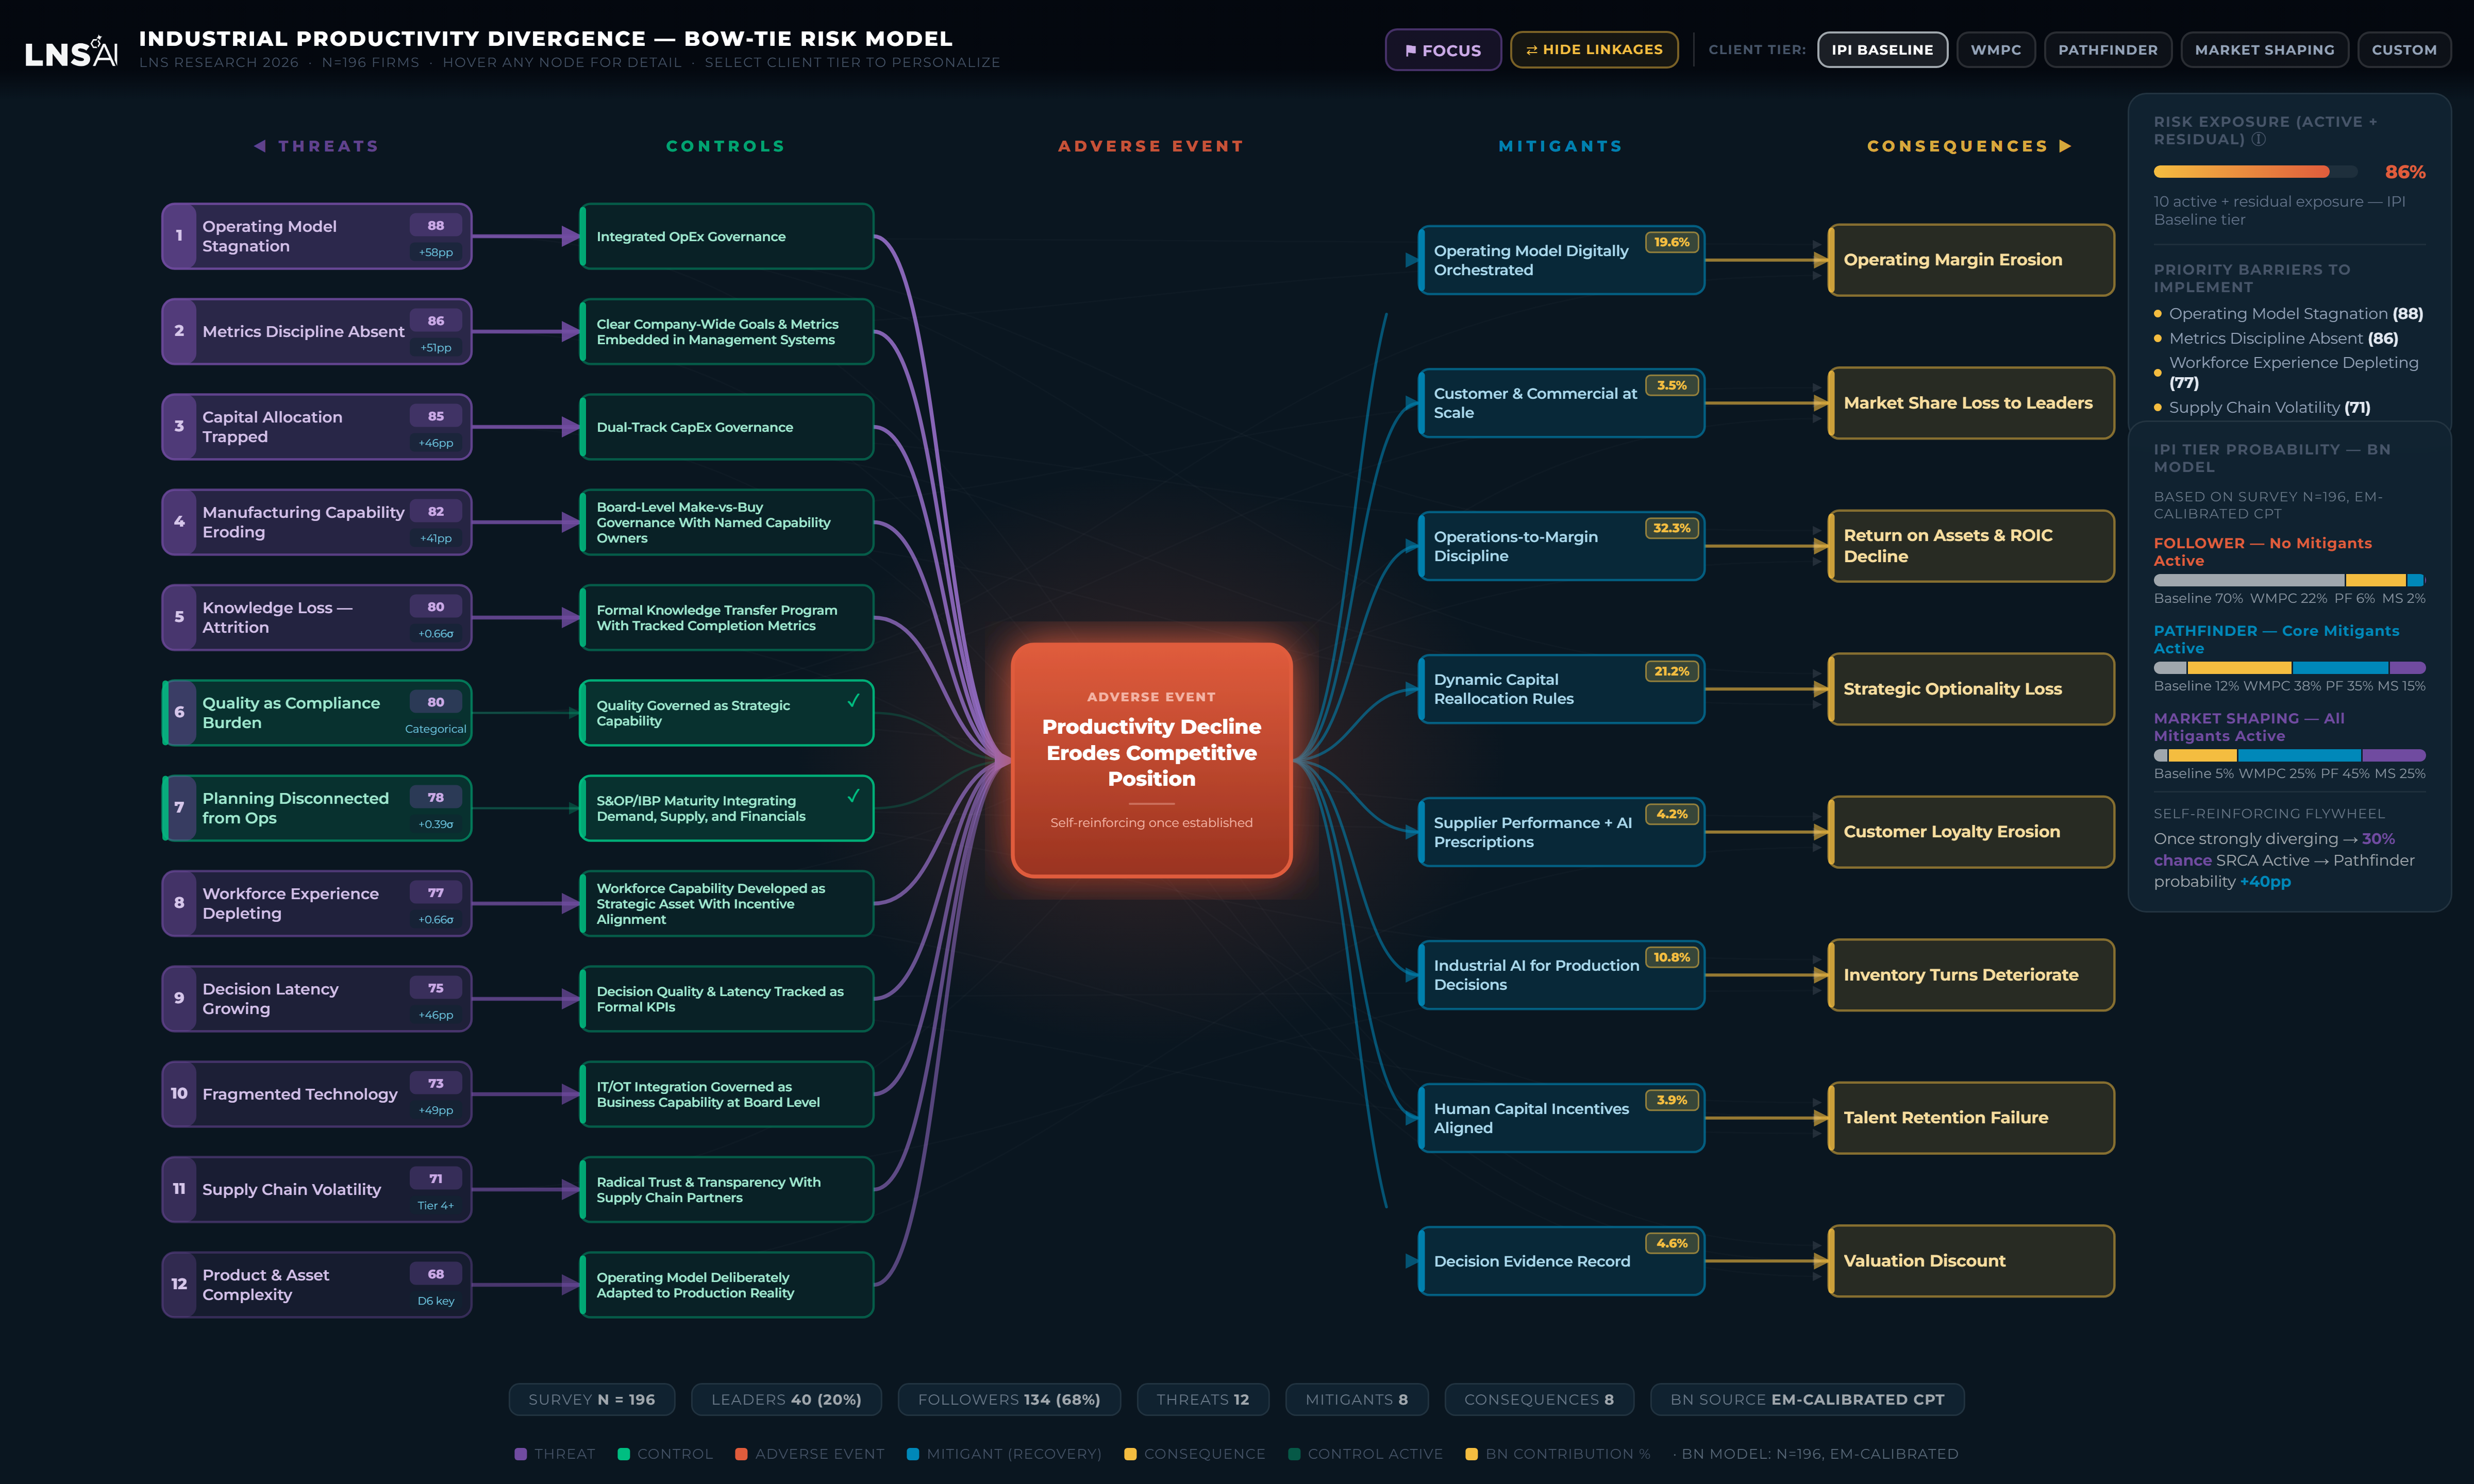
The most valuable part of the research goes beyond the rankings. Using causal modeling across nearly 200 industrials, LNS identifies the threats that set productivity decline inmotion. The most influential is operating model stagnation: running a modern, complex, distributed business on an operating model designed for a slower, more vertically integrated era.
Among the strongest protections?A digitally orchestrated operating model running on current data rather than month-end reporting, and industrial AI applied to production decisions ratherthan confined to dashboards.
This is the argument I’ve been making about digital twins. You can’t afford to look at yesterday’s grid (or yesterday’s plant) while making today’s decisions. Twins anchor AI inoperational reality and give it the context to differentiate between assets, locations, and use cases. The LNS data suggests the companies pulling ahead have internalized that, while the rest are still managing through the rear view mirror of monthly reporting.
Arcobi’s DataHub is built on exactly thispremise: market signals available in real time, not at month-end. Our AI/ML-driven digital twins forecast market trends, simulate asset operations,and connect the gap between signal and decision.
Resilience Is a Control, Not a Cost
Another top threat in the model should sound familiar: institutional knowledge lost as experienced staff retire faster than their expertise is captured. The corresponding control is a formal knowledge transfer program with tracked completion, treated as governance, not aspiration.
The overlooked requirement in automation is human resilience, and this data reinforces it. The leaders aren’t the companies that automated the most aggressively. They’re the ones that put AI into production decisions while keeping people close to those decisions —validating recommendations, monitoring behavior as conditions shift, and preserving the judgment that safeguards operations when the technology fails. De-skilling is a productivity threat, even when it looks like a cost win.
Practical Takeaways for Operating Leaders
• Benchmark honestly. Compare your productivity trajectory against the most productive companies in your industry and peer group, not against your own plan. The gap widens every year you wait.
• Fund optionality. When every investment mustclear an ROI gate, capability investments without a clean payback get deferred— and capability is exactly what compounds. Run a dual-track capital processthat funds strategic optionality deliberately.
• Operate on current data. Move from month-end reporting to a digitally orchestrated operating model. Digital twins are the most practical path to get there, and the 2026 LNS data now makes the case empirically.
• Protect human judgment. Formalize knowledge transfer, run “AI-off” drills, and celebrate the moments a human catches what the system missed. Resilience must be exercised or it weakens.
Stability Is Not Safety
The 2025 recovery gives operating leaders a more stable starting point, but stability and safety arenot the same thing. The flywheels are still turning — in both directions. The companies that pull ahead over the next five years won’t be the ones that automate the most. They’ll be the ones that compound: productivity funding capability, capability funding the next gain.
In productivity, as in energy, the question isn’t whether you’re moving. It’s whether your advantage is feeding itself.
About Arcobi
Arcobi (formerly Arcus Power) is an energy intelligence platform for commercial and industrial energy buyers, battery storage operators, renewables companies, and independent power producers across North American deregulated markets including ERCOT, PJM, AESO, NYISO, and ISONE.
Explore our platform: arcobi.com
Some Related Cases


Let's explore your energy challenge together.
Every energy challenge is different. Tell us yours, and
we'll show you what 25 years of market intelligence can do.