

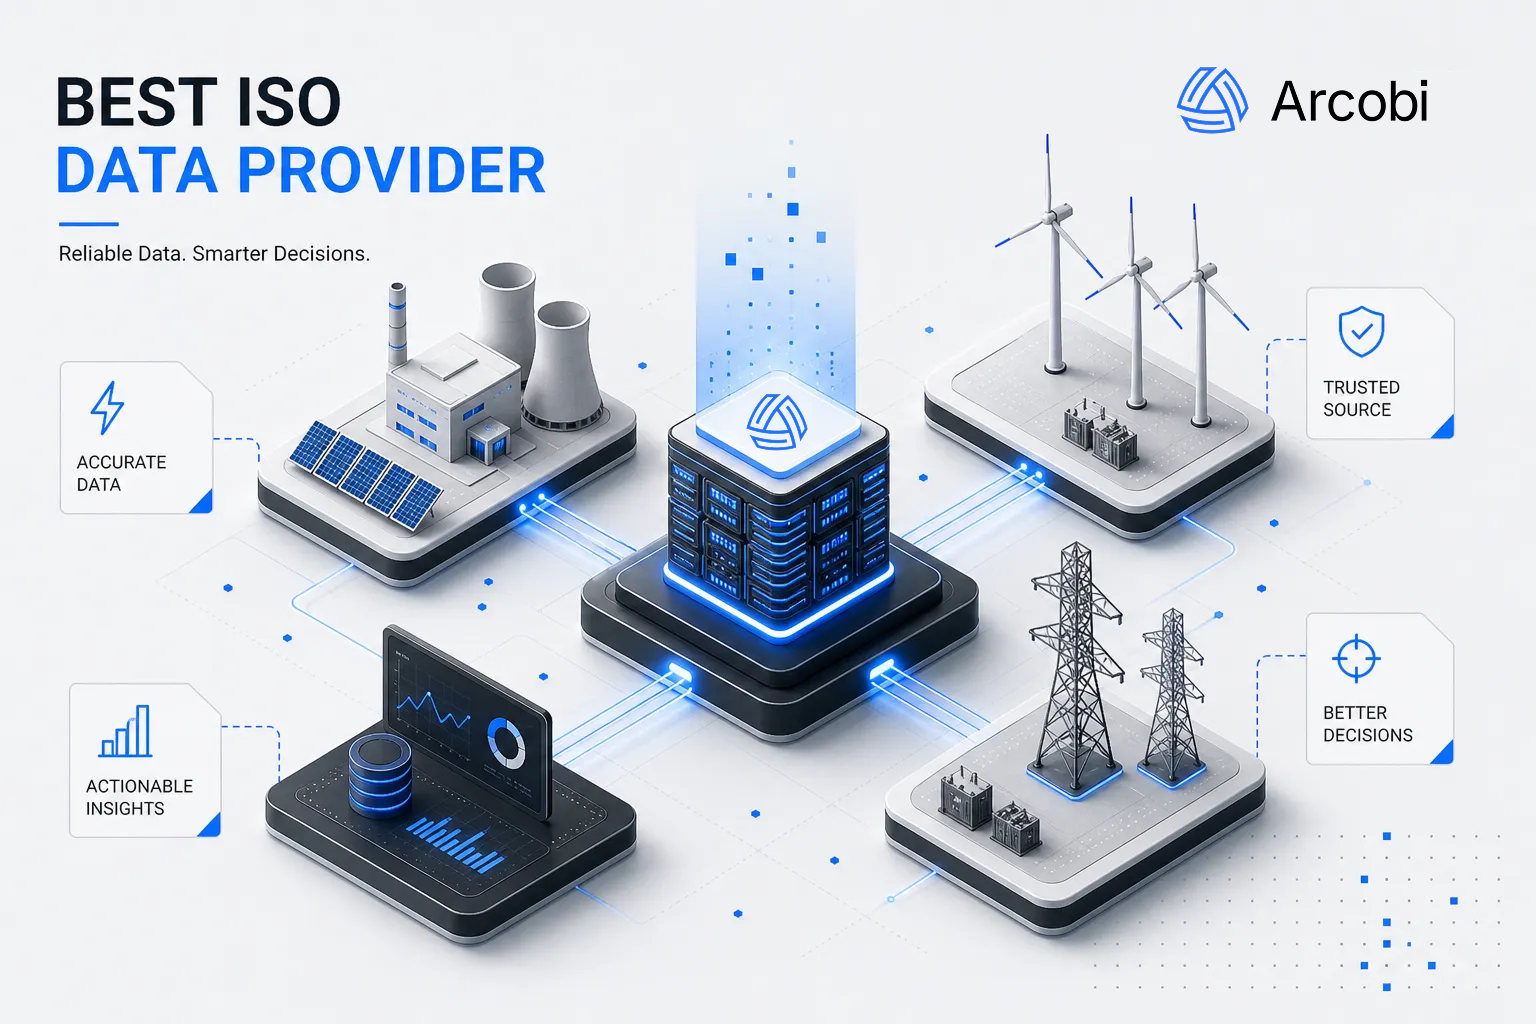
Ask a data vendor for 20+ years of ERCOT nodal prices, then time how long the sample takes to arrive.
The best ISO data provider clears four bars. It has deep history, ideally 15 to 20+ years for the markets you trade. It covers nodal data across every ISO in your portfolio. It gets that data into your stack without a pipeline build on your side. And it puts you in front of people who understand LMP markets.
Miss one, and the gap shows up later as broken models, delayed analysis and missed market windows.
This guide lays out the criteria, gives you a weighted scorecard to test any vendor, and compares representative providers. We're Arcobi, so we use our own DataHub as the reference point. Hold us to the same scorecard.
Key takeaways
- Historical depth: Aim for 15 to 20+ years of normalized LMP, load and ancillary service data, and check the start date for each ISO and each dataset.
- Coverage means nodal: Full coverage means nodal LMPs, DA/RT spreads, capacity and ancillary service data across every ISO you trade, including AESO and IESO if you have Canadian exposure.
- Delivery sets your time to insight: Data that lands in your cloud or API without custom collectors gets analysts modeling sooner.
- Normalization protects your models: Inconsistent historical data produces confident, wrong outputs.
- Score before you sign: Use the five-criteria weighted framework, and treat verifiable sourcing and data lineage as pass/fail gates.
- Test Arcobi the same way: DataHub holds 25+ years of North American power market data across nine ISOs. Ask for a live pull on your own nodes.
Five criteria separate reliable ISO data from expensive data
Most market participants don't have a systematic way to judge power market data quality. They pick whatever a peer firm uses, or whatever ranks first in search.
Bad data produces bad models. Bad models produce bad trades.
Each of the five criteria below carries operational weight. Skip one, and it surfaces in production.
Short histories miss the events that break models
Five to ten years of data won't support serious backtesting or model validation.
If you're training a price forecasting model or stress-testing battery storage dispatch, you need data that spans the events that broke assumptions. ERCOT's February 2011 rolling outages. The January 2014 Polar Vortex across PJM and the Northeast. Winter Storm Uri in February 2021, when ERCOT wholesale prices held at or near the $9,000/MWh cap for roughly 77 hours, according to the EIA.
Each event produced extreme LMPs, demand response activations and ancillary service behavior that a shorter dataset can't show you.
Treat 15 to 20+ years of normalized, granular LMP, load and ancillary service data as the floor for quantitative work. Twenty-plus years widens your sample of rare events. Whatever the headline figure, confirm the actual start date for each ISO and each metric.
"Full coverage" is the most overstated claim in the market
Vendors use "full coverage" loosely. For a buyer, it should mean nodal LMPs, DA/RT spreads, bid stacks, capacity market data and forward curves across every market you trade.
In the U.S., that's seven ISO/RTOs: PJM, ERCOT, MISO, CAISO, NYISO, ISO-NE and SPP. If you hold assets or load in Canada, add AESO and IESO.
Gaps in node coverage, uneven update cadences and missing ancillary data create blind spots, and they hurt most when prices move fast. A provider that covers six of your seven markets well still leaves you blind in the seventh.
Delivery is the criterion procurement teams underweight
Data quality doesn't help you if getting the data into your workflow takes weeks of engineering.
Trading desks and quant teams often ask what data exists and forget to ask how they'll reach it day to day. Picture a team whose provider requires a custom pipeline build for every new node or date range. The engineering overhead alone can push the first model back by weeks.
Pipeline-heavy delivery moves the maintenance onto your team
Two delivery models dominate.
In the first, you write the ingestion code, maintain it every time an ISO changes a schema, and own every gap when a collector breaks. In the second, the provider handles collection, normalization and validation, and the data arrives ready to query through a cloud share, an API or a spreadsheet extract.
The pipeline model costs engineering hours. It also costs timing. When a market signal shows up and your team is debugging a broken collector, the analysis waits. For a storage operator validating a new dispatch strategy before the next operating day, that delay hits the P&L.
Accuracy depends on how a provider handles restatements
Accuracy in ISO/RTO data means consistent node mapping through market design changes, normalized units and careful handling of restated settlement data. ISOs restate prices after market reruns, corrections and settlement adjustments.
We covered where ISO pricing data goes wrong in detail, from LMP decomposition to DST transitions to schema drift.
A provider that overwrites initial values without keeping a version history erases the difference between what was known at the time and the final ex-post price. That bias flows into every backtest built on the data.
Badly normalized history does its damage quietly. It produces confident, wrong outputs, and you find out only when something breaks.
Score every ISO data provider with the same weighted framework
Apply the five criteria to every vendor on your list. Set pass/fail gates first. If a provider can't show verifiable sourcing from ISO/RTO portals and a documented data quality process, drop them before scoring starts.
A five-criteria weighted scorecard
These weights reflect common operational priorities. Adjust them to your team's risk profile and use case.
- Historical data depth (25%): Does it cover 15 to 20+ years of granular, normalized LMP, load and ancillary service data in your target markets? Check start dates per ISO and dataset.
- Multi-ISO coverage (25%): Does it cover every ISO in your portfolio, including nodal data and less common products such as capacity auctions and regulation signals?
- API and delivery quality (20%): Can your team access data without custom pipeline builds? Is the API documented, reliable and versioned?
- Data accuracy and normalization (20%): How does the provider handle node remapping, restatements and settlement revisions?
- Customer support and market expertise (10%): Are your support contacts power market practitioners, or a general helpdesk?
Five red flags that end an evaluation
Some problems end the evaluation on their own.
Watch for unexplained gaps in historical data, especially in early years that include major market events. Make the vendor document start dates per ISO and metric instead of quoting a headline range.
Disqualify providers with hub-only coverage, no documented data lineage or QA process, or API access that depends on a long custom build engagement.
Support routed through a generic helpdesk with no power market expertise is a structural problem. If a vendor can't talk fluently about LMP components, node lifecycle changes or DST handling, treat them as a file distributor and evaluate them that way.
How representative ISO data providers score
Providers range from niche vendors to full market intelligence platforms. The table scores representative providers from 1 to 5 on each criterion, based on publicly available documentation and feature comparisons. A 5 means best in class.
Totals are unweighted, so apply your own weights from the scorecard above. Capabilities change, so check every claim against current vendor documentation.
Why we use DataHub as the benchmark
Most procurement decisions stall on depth versus usability. Providers with deep history usually make you build the pipeline to reach it. Self-service tools often trim history or nodal detail to keep the interface simple.
DataHub is designed to close that gap. It holds 25+ years of power market data across nine North American ISOs (AESO, CAISO, ERCOT, IESO, ISO-NE, MISO, NYISO, PJM and SPP).
You choose how it arrives: push-to-cloud through the Snowflake Marketplace, a RESTful API, the Arcobi SDK, Excel extractions or dashboards. Teams that work inside AI assistants can also query Arcobi data through MCP. You can see every supported connection here.
For trading desks, quant researchers and IPP operations teams, that cuts setup time. Ask for a proof of concept on your own nodes and date ranges before you decide.
What pipeline-free ISO data looks like on a trading desk
A backtest without the engineering ticket
A quant researcher at a power trading firm needs 20 years of ERCOT nodal LMPs, hourly load shapes and ancillary service clearing prices to backtest a new battery dispatch model.
With a pipeline-heavy provider, that's an engineering project measured in weeks. Data tickets, custom collectors, normalization scripts and validation cycles, all before modeling starts.
With DataHub, the normalized data lands in the firm's Snowflake account or comes through the API, and the researcher starts on the backtest. No collector to build. The strategy reaches the desk while the opportunity still exists.
IPPs running assets in several ISOs use the same access for multi-region portfolio analysis and DA/RT spread work, with one data relationship instead of one per market.
Teams that gain the most from this kind of access
Pipeline-free ISO data pays off most where data-to-decision speed drives results.
Quant researchers and trading engineers run more model iterations and test more strategies. IPP and utility operations teams manage one data relationship across regions instead of several. Storage operators get the historical data to validate a dispatch strategy before entering a new market, which lowers first-month execution risk.
If you need more than raw data, Arcobi also runs AI forecasting for price and demand, plus a staffed Power Operations Center for dispatch. Our case studies show how customers use them.
Three questions that expose a weak ISO data provider
Once you've scored the field, run live due diligence with your shortlist. These three questions reveal more than any feature sheet.
- Show me data for these nodes and this date range, right now. A serious provider can run a live pull on the exact data you need. If they need days to prepare a sample, expect the same delay in production every time you ask for something outside the standard package.
- How do you handle market design changes, node remapping and settlement restatements? The answer shows whether the data team understands power markets or repackages raw portal downloads. A provider that can't explain node lifecycle management or restatement versioning is running a file mirror.
- What does day one look like, and when will my team pull data on its own? Ask for a time-to-first-query demonstration on your own nodes and date range. That's the only benchmark that matters for your workflow.
The best ISO data provider is the one that moves clean, deep, multi-ISO nodal data from the market to your next decision with the least friction. Score the field, run a proof of concept on your own nodes, and test market expertise past the feature list.
The data exists either way. The question is whether your team spends next quarter modeling with it or maintaining collectors for it.
If you want to put DataHub through that test, book a live demonstration with your own use case.
Frequently asked questions
How many ISO/RTO markets does "full coverage" include?
In the U.S., seven: PJM, ERCOT, MISO, CAISO, NYISO, ISO-NE and SPP. North American coverage adds Alberta's AESO and Ontario's IESO, for nine. Full coverage means nodal LMPs, DA/RT spreads, bid stacks, capacity market data and ancillary services across those markets, beyond headline hub prices. If you were searching for ISO standards rather than ISO market data, this explainer covers the difference.
What does pipeline-free access mean?
The provider collects, normalizes and validates the data, and it reaches you ready to query in your cloud environment, through an API or in a spreadsheet extract. Your team doesn't write or maintain ingestion code.
What red flags should disqualify a data provider?
Unexplained historical data gaps, hub-only coverage with no nodal granularity, no documented data lineage or QA process, and API access that depends on a long custom build. Also disqualify providers whose support runs through a generic helpdesk, or who can't explain node lifecycle management and restatement versioning.
How should I verify the historical depth a vendor claims?
Ask for exact dataset start dates per ISO and metric instead of accepting a headline range such as "15 to 20 years." Then have the vendor pull normalized LMP, load and ancillary service data for your target markets, starting at those dates.
Some Related Cases




Let's explore your energy challenge together.
Every energy challenge is different. Tell us yours, and
we'll show you what 25 years of market intelligence can do.
